Comparative Study
. 2007 Jun 11;204(6):1463-74.
doi: 10.1084/jem.20062602. Epub 2007 Jun 4.

MyD88-dependent expansion of an immature GR-1(+)CD11b(+) population induces T cell suppression and Th2 polarization in sepsis

Affiliations
Comparative Study

MyD88-dependent expansion of an immature GR-1(+)CD11b(+) population induces T cell suppression and Th2 polarization in sepsis

Matthew J Delano et al. J Exp Med. .

Abstract

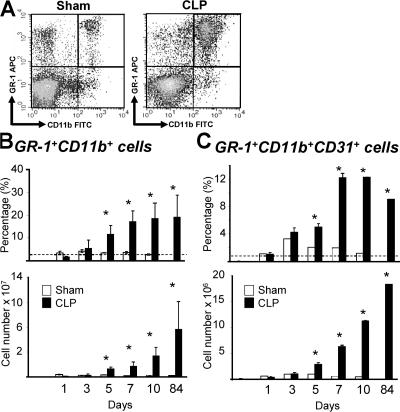
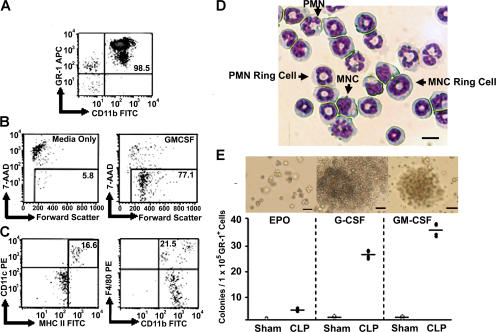
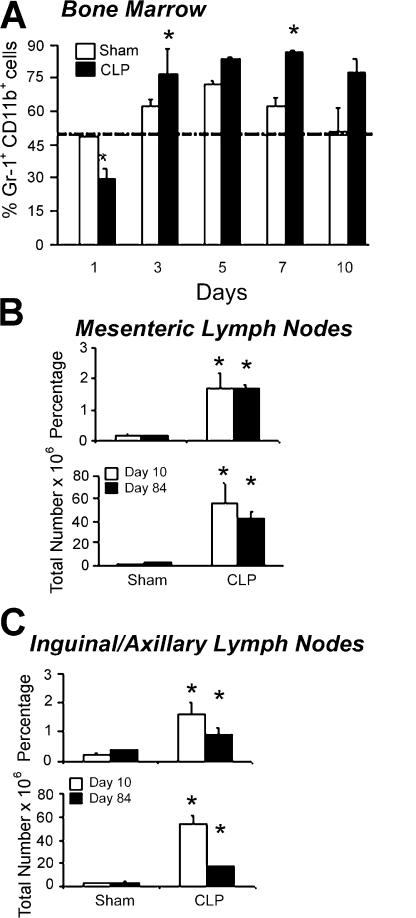
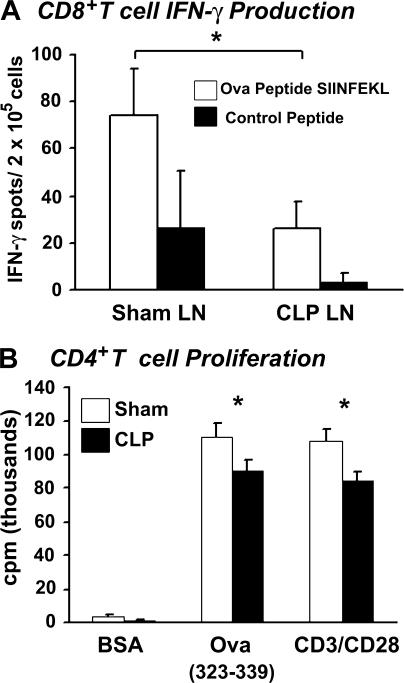
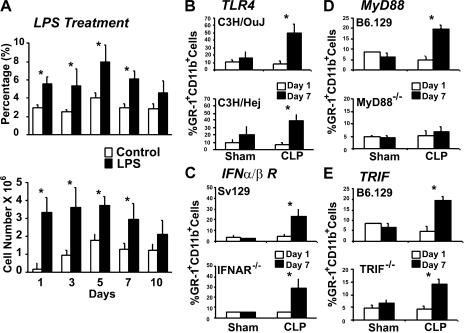
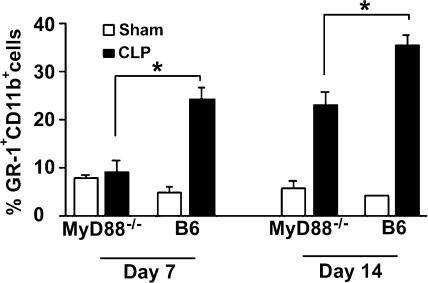
Polymicrobial sepsis alters the adaptive immune response and induces T cell suppression and Th2 immune polarization. We identify a GR-1(+)CD11b(+) population whose numbers dramatically increase and remain elevated in the spleen, lymph nodes, and bone marrow during polymicrobial sepsis. Phenotypically, these cells are heterogeneous, immature, predominantly myeloid progenitors that express interleukin 10 and several other cytokines and chemokines. Splenic GR-1(+) cells effectively suppress antigen-specific CD8(+) T cell interferon (IFN) gamma production but only modestly suppress antigen-specific and nonspecific CD4(+) T cell proliferation. GR-1(+) cell depletion in vivo prevents both the sepsis-induced augmentation of Th2 cell-dependent and depression of Th1 cell-dependent antibody production. Signaling through MyD88, but not Toll-like receptor 4, TIR domain-containing adaptor-inducing IFN-beta, or the IFN-alpha/beta receptor, is required for complete GR-1(+)CD11b(+) expansion. GR-1(+)CD11b(+) cells contribute to sepsis-induced T cell suppression and preferential Th2 polarization.


Figures

Figure 1.
Figure 1.
Appearance of GR-1+CD11b+ cells in spleens from septic and sham mice. (A) Flow cytometry dot plot of viable splenocytes gated on GR-1+ and CD11b+ staining. (B) Percentages and total numbers of GR-1+CD11b+ splenocytes recovered from mice at intervals after CLP and sham treatment. (C) Percentages and total numbers of GR-1+CD11b+CD31+ splenocytes recovered from mice at intervals after CLP and sham treatment. Sepsis induced by CLP produced 50-fold increases in numbers of GR-1+CD11b+ splenocytes. The dashed lines represent the percentages of GR-1+CD11b+ cells (B) and the percentages of GR-1+CD11b+CD31+ cells (C) in control animals that are neither sham nor CLP treated. Values represent the mean and standard error of 5–10 animals per group. *, P < 0.01 by analysis of variance and the Student-Newman-Keuls multiple range test. CLP, cecal ligation and puncture.
Figure 2.
Figure 2.
Flow cytometric analysis of GR-1+ splenocytes cultured with GM-CSF, G-CSF, or erythropoietin ex vivo. (A) Flow cytometric analysis of enriched GR-1+ splenocytes obtained from septic mice 10 d after CLP. (B) Cells were cultured for 7 d with media alone or media and GM-CSF, and cell viability was determined by 7-amino-actinomycin D staining. Cells cultured without GM-CSF rapidly died. (C) GR-1+–enriched splenocytes cultured with GM-CSF for 7 d yielded a phenotypically diverse cell population staining positive for CD11c and F/480. (D) Cytospin preparation of enriched GR-1+ cells 10 d after CLP demonstrated immature heterogeneous myeloid phenotypes with characteristic ring shaped nuclei. Bar, 5 μm. (E) Colony-forming units of GR-1+–enriched splenocytes cultured with G-CSF, GM-CSF, or EPO for 10 d in soft methylcellulose. The images distinguish the nature of the colonies, reflecting primarily neutrophil- and monocyte-like colonies in the G-CSF– and GM-CSF–treated groups, respectively. Bars, 15 μm. Values in A–C represent the mean and standard error of 5–10 animals per group, and the numbers in the quadrants represent the percentage of cells in that quadrant based on the total number of cells that were gated. Horizontal lines indicate the mean number of colonies per group. CLP, cecal ligation and puncture; EPO, erythropoietin; MNC, mononuclear cell; PMN, polymorphonuclear.
Figure 3.
Figure 3.
Bone marrow and lymph node GR-1+CD11b+ cells from septic and sham mice. CLP produced a rapid increase in the numbers of GR-1+CD11b+ cells in the bone marrow (A) and lymph nodes (B and C). A sham procedure produced a more transient modest increase. Values represent the mean and standard error of 5–10 animals per group. Dashed line indicates the mean percentage from healthy control animals not subjected to CLP or sham procedures. *, P < 0.01 between CLP and sham-treated animals by the Student's t test. CLP, cecal ligation and puncture.
Figure 4.
Figure 4.
Hematoxylin and eosin–stained spleens from septic mice 10 d after CLP. (A) Low power view, with the perivascular region identified (inset). (B) High power view of the perivascular region showing cuffing and infiltration, with myeloid cells showing characteristic ring features (black arrows). Note the mitotically active cell (white arrow). (C) High power view of the subcapsular region also showing infiltration, with myeloid cells exhibiting characteristic ring features (arrows). (D) CD11b+ staining of the spleen from a septic animal 10 d after CLP. (E) CD11b+ staining of the spleen from a sham-treated animal 10 d after surgical procedure. In the sham animal, CD11b+ staining is distributed in the mantel region surrounding T cell–rich follicles. After 10 d of sepsis, additional CD11b+ staining appears in the perivascular and subcapsular regions. (F) High power view of staining of the perivascular region showing CD11b+ staining from a 10-d septic animal. (G) High power view showing resolution of the subcapsular region showing CD11b+ staining from a septic animal. Bars, 100 μm. CLP, cecal ligation and puncture.
Figure 5.
Figure 5.
Effect of ex vivo LPS stimulation on cytokine expression in GR-1+ splenocytes obtained from septic mice. When GR-1+ splenocytes were harvested from 7-d sham-treated or septic mice and stimulated with 10 μg/ml of bacterial LPS, IL-1α, IL-1β, IL-6, IL-10, TNF-α, RANTES, MIP-1β, and KC/CXCL1 production was significantly increased in all groups stimulated with LPS. Importantly, GR-1+ splenocytes from septic mice secreted more IL-10, TNF-α, RANTES, and MIP-1β production after LPS administration than GR-1+ splenocytes from sham-treated animals. Values represent the mean ± SEM of between four and six samples. *, P < 0.05 by the Student's t test.
Figure 6.
Figure 6.
Ig production after NP-KLH immunization in sham mice, septic mice, and septic mice depleted of GR-1+ cells. 9 and 10 d after induction of sepsis by CLP, mice were depleted of GR-1+ cells by the i.p. administration of RB6-8C5 anti-GR-1 antibody, as described in Materials and methods. Mice were then immunized with NP-KLH. 7 d later, mice were bled, and serum IgM (A), total IgG (B), IgG1 (C), and IgG2a (D) responses to NP-KLH immunization were determined. Sepsis produced no difference in the IgM response while concomitantly producing an increase in the total serum IgG and IgG1 and a decrease in the serum IgG2a response consistent with Th2 polarization. The total IgG, IgG1, and IgG2a responses after sepsis were prevented by depletion of the GR-1+ cells. Horizontal lines represent the means for each group of samples. *, P < 0.01 by analysis of variance and the Student-Newman-Keuls multiple range test. CLP, cecal ligation and puncture.
Figure 7.
Figure 7.
Effect of GR-1+ cells from septic mice on antigen-specific CD4+ T cell proliferation and CD8+ T cell IFN-γ responses. Mice were treated as described in Materials and methods. GR-1+ cells from septic animals markedly attenuated the IFN-γ production (determined by ELISPOT) by OT-1 splenocytes stimulated with either control peptide or OVA-derived peptide SIINFEKL ex vivo after administration and immunization in C57BL/6 mice (A). In contrast, GR-1+ splenocytes from 10-d septic mice had only a minimal but significant suppressive effect on antigen-specific and nonspecific CD4+ T cell proliferative responses in OVA antigen-specific, DO11.10 mice (B). Values represent the mean and standard error of five animals per group. The experiment was repeated twice, and the values presented are from one representative experiment. *, P < 0.05 by analysis of variance and the Student-Newman-Keuls multiple range test.
Figure 8.
Figure 8.
Effects of LPS and transgenic mice on the expansion of the splenic GR-1+CD11b+ population 7 d after CLP. (A) Mice received either nothing or the i.p. injection of 5 mg/kg body weight of bacterial LPS and were killed at intervals thereafter. LPS injection increased the percentage of GR-1+CD11b+ cells in the spleen within 1 d, and expansion of this cell population remained for about 7 d. CLP was induced in C3H/HeJ (TLR4 mutant; B), IFN-α/βR−/− (C), MyD88−/− (B6 × 129; D), and TRIF−/− (E) mice, as described in Materials and methods. 1 and 7 d later, splenic GR-1+CD11b+ populations were examined in the spleens of knockout mice and their appropriate background controls. Normal expansion of the GR-1+CD11b+ splenocytes was seen in all mice at 7 d, with the exception of the MyD88−/− mice that failed to demonstrate an increase in their GR-1+CD11b+ population. Values represent the mean and standard error of five animals per group. *, P < 0.01 versus control at the same time point, as determined by the Student's t test. CLP, cecal ligation and puncture.
Figure 9.
Figure 9.
Requirement for MyD88−/− signaling in the expansion of GR-1+CD11b+ splenocytes in response to prolonged sepsis. MyD88−/− mice on a C57BL/6 background and wild-type controls underwent CLP, and the representative animals were killed at 7 and 14 d after induction of sepsis. The relative and absolute numbers of GR-1+CD11b+ splenocytes were determined, as previously described in Fig. 1. As seen in the MyD88−/− B6 × 129 animals, there was no increase in the GR-1+CD11b+ splenocyte population 7 d after sepsis. However, there was an increase in the GR-1+CD11b+ population at 14 d, although it was modest compared with the wild-type animals. *, P < 0.01 versus control at the same time point, as determined by the Student's t test. CLP, cecal ligation and puncture.

Similar articles

Cited by

References

    1. Hotchkiss, R.S., and I.E. Karl. 2003. The pathophysiology and treatment of sepsis. N. Engl. J. Med. 348:138–150. - PubMed
    1. Riedemann, N.C., R.F. Guo, and P.A. Ward. 2003. The enigma of sepsis. J. Clin. Invest. 112:460–467. - PMC - PubMed
    1. Hotchkiss, R.S., K.W. Tinsley, P.E. Swanson, R.E. Schmieg Jr., J.J. Hui, K.C. Chang, D.F. Osborne, B.D. Freeman, J.P. Cobb, T.G. Buchman, and I.E. Karl. 2001. Sepsis-induced apoptosis causes progressive profound depletion of B and CD4+ T lymphocytes in humans. J. Immunol. 166:6952–6963. - PubMed
    1. Oberholzer, C., A. Oberholzer, F.R. Bahjat, R.M. Minter, C.L. Tannahill, A. Abouhamze, D. LaFace, B. Hutchins, M.J. Clare-Salzler, and L.L. Moldawer. 2001. Targeted adenovirus-induced expression of IL-10 decreases thymic apoptosis and improves survival in murine sepsis. Proc. Natl. Acad. Sci. USA. 98:11503–11508. - PMC - PubMed
    1. Murphey, E.D., C.Y. Lin, R.W. McGuire, T. Toliver-Kinsky, D.N. Herndon, and E.R. Sherwood. 2004. Diminished bacterial clearance is associated with decreased IL-12 and interferon-gamma production but a sustained proinflammatory response in a murine model of postseptic immunosuppression. Shock. 21:415–425. - PubMed

Publication types