. 2007 Jun 4:1:24.
doi: 10.1186/1752-0509-1-24.

Understanding network concepts in modules

Affiliations

Understanding network concepts in modules

Jun Dong et al. BMC Syst Biol. .

Abstract

Background: Network concepts are increasingly used in biology and genetics. For example, the clustering coefficient has been used to understand network architecture; the connectivity (also known as degree) has been used to screen for cancer targets; and the topological overlap matrix has been used to define modules and to annotate genes. Dozens of potentially useful network concepts are known from graph theory.

Results: Here we study network concepts in special types of networks, which we refer to as approximately factorizable networks. In these networks, the pairwise connection strength (adjacency) between 2 network nodes can be factored into node specific contributions, named node 'conformity'. The node conformity turns out to be highly related to the connectivity. To provide a formalism for relating network concepts to each other, we define three types of network concepts: fundamental-, conformity-based-, and approximate conformity-based concepts. Fundamental concepts include the standard definitions of connectivity, density, centralization, heterogeneity, clustering coefficient, and topological overlap. The approximate conformity-based analogs of fundamental network concepts have several theoretical advantages. First, they allow one to derive simple relationships between seemingly disparate networks concepts. For example, we derive simple relationships between the clustering coefficient, the heterogeneity, the density, the centralization, and the topological overlap. The second advantage of approximate conformity-based network concepts is that they allow one to show that fundamental network concepts can be approximated by simple functions of the connectivity in module networks.

Conclusion: Using protein-protein interaction, gene co-expression, and simulated data, we show that a) many networks comprised of module nodes are approximately factorizable and b) in these types of networks, simple relationships exist between seemingly disparate network concepts. Our results are implemented in freely available R software code, which can be downloaded from the following webpage: http://www.genetics.ucla.edu/labs/horvath/ModuleConformity/ModuleNetworks.


Figures
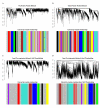
Figure 1
Figure 1
Hierarchical clustering dendrogram and module definition. A) Drosophila PPI network. The dendrogram results from average linkage hierarchical clustering. The color-band below the dendrogram denotes the modules, which are defined as branches in the dendrogram. Of the 1371 proteins, 862 were clustered into 28 proper modules, and the remaining proteins are colored in grey; B) yeast PPI network; C) weighted gene co-expression network (yeast); D) unweighted gene co-expression network (yeast). To facilitate a comparison between the weighted and the unweighted gene co-expression networks, we used the module assignment of C) in D). Note that the colors of C) tend to stay together in D), which illustrates high module preservation.
Figure 2
Figure 2
Drosophila PPI module networks: the relationship between fundamental network concepts NetworkConcept(A - I) (y-axis) and their approximate CF-based analogs NetworkConceptCF,app (x-axis). This figure demonstrates Observation 2. A) Density versus DensityCF,app; B) Centralization versus CentralizationCF,app; C) Heterogeneity versus HeterogeneityCF,app; D) Intramodular clustering coefficients ClusterCoefi versus ClusterCoefCF,app. In Figures A), B) and C), each dot corresponds to a module since these network concepts summarize an entire network module. In Figure D), each dot corresponds to a node since these network concepts are node specific. A reference line with intercept 0 and slope 1 has been added to each plot.
Figure 3
Figure 3
Yeast PPI module networks: the relationship between fundamental network concepts NetworkConcept(A - I) (y-axis) and their approximate CF-based analogs NetworkConceptCF,app (x-axis). This figure demonstrates Observation 2. A) Density versus DensityCF,app; B) Centralization versus CentralizationCF,app; C) Heterogeneity versus HeterogeneityCF,app; D) Intramodular clustering coefficients ClusterCoefi versus ClusterCoefCF,app. In Figures A), B) and C), each dot corresponds to a module since these network concepts summarize an entire network module. In Figure D), each dot corresponds to a node since these network concepts are node specific. A reference line with intercept 0 and slope 1 has been added to each plot.
Figure 4
Figure 4
Yeast gene co-expression module networks: the relationship between fundamental network concepts NetworkConcept(A - I) (y-axis) and their approximate CF-based analogs NetworkConceptCF,app (x-axis). This figure demonstrates Observation 2. A reference line with intercept 0 and slope 1 has been added to each plot. The figures on the left (right) hand side depict network concepts from the weighted (unweighted) network. A) and B) Centralization versus CentralizationCF,app; C) and D) Heterogeneity versus HeterogeneityCF,app; E) and F) Intramodular clustering coefficients ClusterCoefi versus ClusterCoefCF,app. The analogous plots for Density are not presented since the fundamental network concepts and their approximate CF-based analogs are almost identical and the dots fall near the reference line with R2 = 1 for both weighted and unweighted networks, and thus are omitted due to limited space. In Figures A), B), C) and D), each dot corresponds to a module since these network concepts summarize an entire network module. In Figure E) and F), each dot corresponds to a node since these network concepts are node specific.
Figure 5
Figure 5
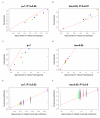
Drosophila PPI module networks: the relationship between fundamental network concepts. This figure demonstrates Observation 3 and equation (14). In Figures A) and B), each point is a protein colored by its module assignment, and the red line has intercept 0 and slope 1. Figure A) illustrates the relationship between the mean clustering coefficient (short horizonal line) and (1 + Heterogeneity2)2 * Density (equation (11)). Figure B) illustrates the relationship between the topological overlap with the hub node and (Density + Centralization) * (1 + Heterogeneity2) (equation (14)). Figure C) is a color-coded depiction of the topological overlap matrix TopOverlapij in the turquoise module network. Figure D) represents the corresponding approximation max(ki,kj)(1 + Heterogeneity2)/n (equation (12)). Figures E) and F) are their analogs for the brown module. The turquoise and the brown module represent the largest and third largest module. Analogous plots for the other modules can be found in our online supplement.
Figure 6
Figure 6
Yeast PPI module networks: the relationship between fundamental network concepts. This figure demonstrates Observation 3 and equation (14). In Figures A) and B), each point is a protein colored by its module assignment and the red line has intercept 0 and slope 1. Figure A) illustrates the relationship between the mean clustering coefficient (short horizonal line) and (1 + Heterogeneity2)2 * Density (equation (11)). Figure B) illustrates the relationship between the topological overlap with the hub node and (Density + Centralization) * (1 + Heterogeneity2) (equation (14)). Figure C) is a color-coded depiction of the topological overlap matrix TopOverlapij in the turquoise module network. Figure D) represents the corresponding approximation max(ki,kj)(1 + Heterogeneity2)/n (equation (12)). Figures E) and F) are their analogs for the brown module. The turquoise and the brown module represent the largest and third largest module. Analogous plots for the other modules can be found in our online supplement.
Figure 7
Figure 7
Yeast gene co-expression module networks: the relationship between fundamental network concepts. This figure demonstrates Observation 3 and equation (14). The figures on the left (right) hand side depict network concepts from the weighted (unweighted) network. Each point is a gene colored by its module assignment. The red line has intercept 0 and slope 1. Figures A) and B) illustrate the relationship between the mean clustering coefficient (short horizonal line) and (1 + Heterogeneity2)2 * Density (equation (11)). Figure C) and D) illustrates the relationship between the topological overlap with the hub node and (Density + Centralization) * (1 + Heterogeneity2) (equation (14)).

Similar articles

Cited by

References

    1. Kim J, Bates DG, Postlethwaite I, Heslop-Harrison P, Cho KH. Least-Squares Methods for Identifying Biochemical Regulatory Networks from Noisy Measurements. BMC Bioinformatics. 2007;8:8. doi: 10.1186/1471-2105-8-8. - DOI - PMC - PubMed
    1. Klamt S, Saez-Rodriguez J, Gilles E. Structural and Functional Analysis of Cellular Networks with Cellnetanalyzer. BMC Systems Biology. 2007;1(2) - PMC - PubMed
    1. Schaub M, Henzinger T, Fisher J. Qualitative Networks: A Symbolic Approach to Analyze Biological Signaling Networks. BMC Systems Biology. 2007;1(4) - PMC - PubMed
    1. Gille C, Hoffmann S, Holzhuetter H. METANNOGEN: Compiling Features of Biochemical Reactions Needed for the Reconstruction of Metabolic Networks. BMC Systems Biology. 2007;1(5) - PMC - PubMed
    1. Sotiropoulos V, Kaznessis Y. Synthetic Tetracycline-Inducible Regulatory Networks: Computer-Aided Design of Dynamic Phenotypes. BMC Systems Biology. 2007;1(7) - PMC - PubMed

Publication types

LinkOut - more resources