

Arabidopsis TFL2/LHP1 specifically associates with genes marked by trimethylation of histone H3 lysine 27
- PMID: 17542647
- PMCID: PMC1885283
- DOI: 10.1371/journal.pgen.0030086
Arabidopsis TFL2/LHP1 specifically associates with genes marked by trimethylation of histone H3 lysine 27
Abstract
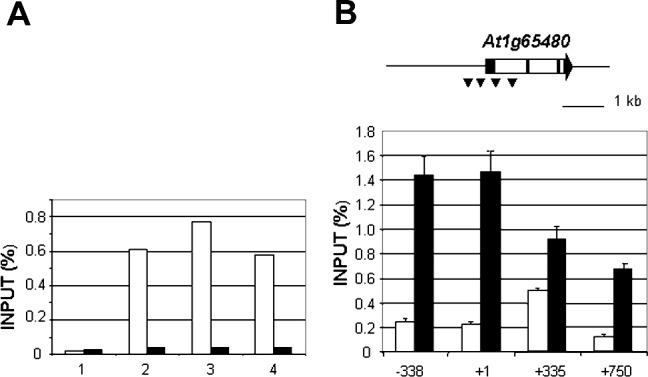
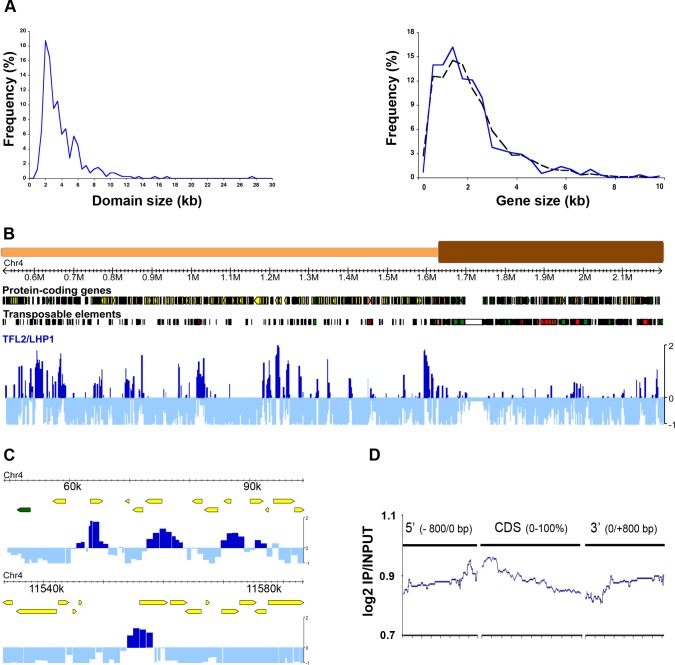
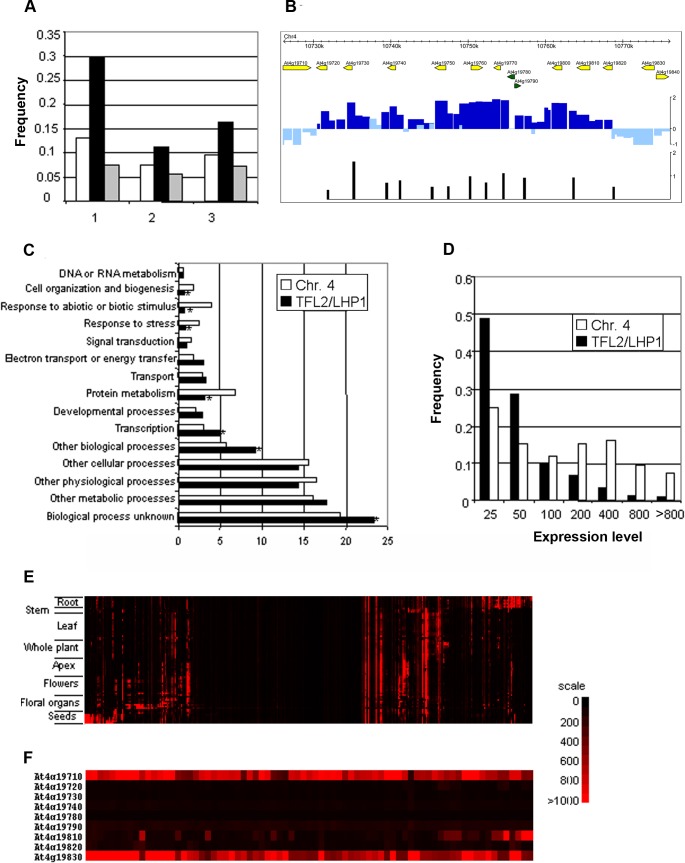
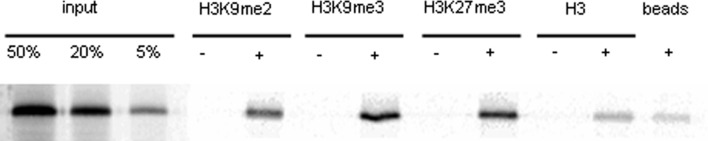
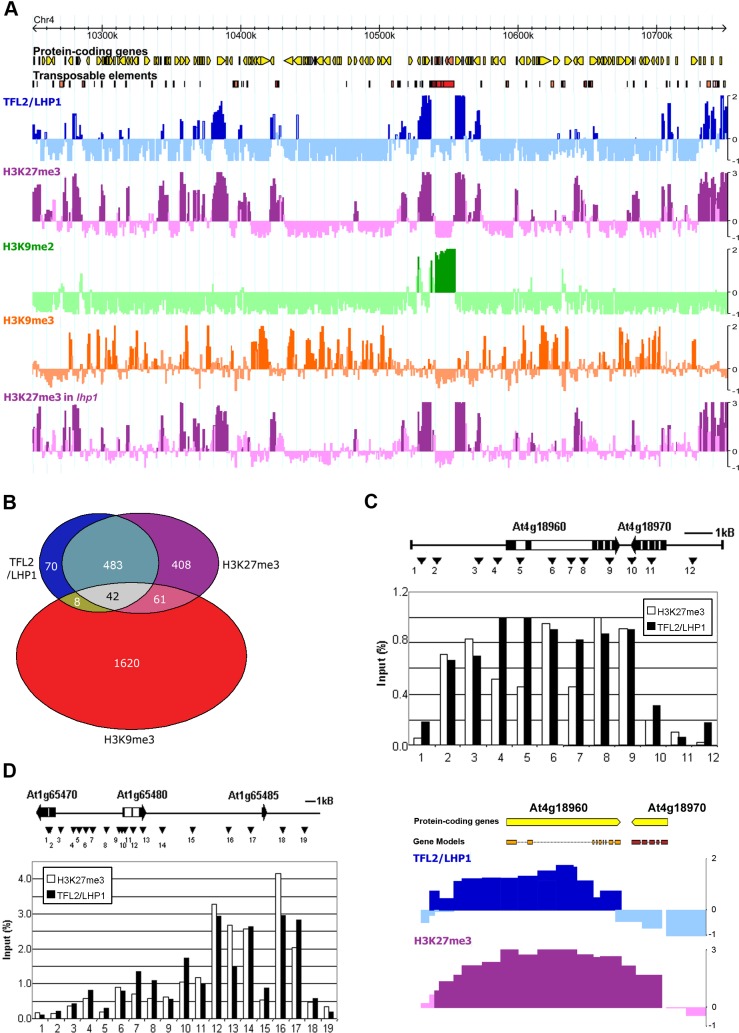
TERMINAL FLOWER 2/LIKE HETEROCHROMATIN PROTEIN 1 (TFL2/LHP1) is the only Arabidopsis protein with overall sequence similarity to the HETEROCHROMATIN PROTEIN 1 (HP1) family of metazoans and S. pombe. TFL2/LHP1 represses transcription of numerous genes, including the flowering-time genes FLOWERING LOCUS T (FT) and FLOWERING LOCUS C (FLC), as well as the floral organ identity genes AGAMOUS (AG) and APETALA 3 (AP3). These genes are also regulated by proteins of the Polycomb repressive complex 2 (PRC2), and it has been proposed that TFL2/LHP1 represents a potential stabilizing factor of PRC2 activity. Here we show by chromatin immunoprecipitation and hybridization to an Arabidopsis Chromosome 4 tiling array (ChIP-chip) that TFL2/LHP1 associates with hundreds of small domains, almost all of which correspond to genes located within euchromatin. We investigated the chromatin marks to which TFL2/LHP1 binds and show that, in vitro, TFL2/LHP1 binds to histone H3 di- or tri-methylated at lysine 9 (H3K9me2 or H3K9me3), the marks recognized by HP1, and to histone H3 trimethylated at lysine 27 (H3K27me3), the mark deposited by PRC2. However, in vivo TFL2/LHP1 association with chromatin occurs almost exclusively and co-extensively with domains marked by H3K27me3, but not H3K9me2 or -3. Moreover, the distribution of H3K27me3 is unaffected in lhp1 mutant plants, indicating that unlike PRC2 components, TFL2/LHP1 is not involved in the deposition of this mark. Rather, our data suggest that TFL2/LHP1 recognizes specifically H3K27me3 in vivo as part of a mechanism that represses the expression of many genes targeted by PRC2.
Conflict of interest statement
Competing interests. The authors have declared that no competing interests exist.
Figures
Similar articles
-
LHP1 Interacts with ATRX through Plant-Specific Domains at Specific Loci Targeted by PRC2.Mol Plant. 2018 Aug 6;11(8):1038-1052. doi: 10.1016/j.molp.2018.05.004. Epub 2018 May 21. Mol Plant. 2018. PMID: 29793052
-
Arabidopsis TERMINAL FLOWER 2 gene encodes a heterochromatin protein 1 homolog and represses both FLOWERING LOCUS T to regulate flowering time and several floral homeotic genes.Plant Cell Physiol. 2003 Jun;44(6):555-64. doi: 10.1093/pcp/pcg091. Plant Cell Physiol. 2003. PMID: 12826620
-
Transcription factors AS1 and AS2 interact with LHP1 to repress KNOX genes in Arabidopsis.J Integr Plant Biol. 2016 Dec;58(12):959-970. doi: 10.1111/jipb.12485. Epub 2016 Jul 20. J Integr Plant Biol. 2016. PMID: 27273574
-
LHP1 Could Act as an Activator and a Repressor of Transcription in Plants.Front Plant Sci. 2017 Nov 28;8:2041. doi: 10.3389/fpls.2017.02041. eCollection 2017. Front Plant Sci. 2017. PMID: 29234344 Free PMC article. Review.
-
Dynamics of H3K27me3 methylation and demethylation in plant development.Plant Signal Behav. 2015;10(9):e1027851. doi: 10.1080/15592324.2015.1027851. Plant Signal Behav. 2015. PMID: 26313233 Free PMC article. Review.
Cited by
-
Enabling photoperiodic control of flowering by timely chromatin silencing of the florigen gene.Nucleus. 2015;6(3):179-82. doi: 10.1080/19491034.2015.1038000. Epub 2015 May 7. Nucleus. 2015. PMID: 25950625 Free PMC article.
-
The plant Polycomb repressive complex 1 (PRC1) existed in the ancestor of seed plants and has a complex duplication history.BMC Evol Biol. 2015 Mar 13;15:44. doi: 10.1186/s12862-015-0319-z. BMC Evol Biol. 2015. PMID: 25881027 Free PMC article.
-
Florigen-Encoding Genes of Day-Neutral and Photoperiod-Sensitive Maize Are Regulated by Different Chromatin Modifications at the Floral Transition.Plant Physiol. 2015 Aug;168(4):1351-63. doi: 10.1104/pp.15.00535. Epub 2015 Jun 17. Plant Physiol. 2015. PMID: 26084920 Free PMC article.
-
PICKLE associates with histone deacetylase 9 to mediate vegetative phase change in Arabidopsis.New Phytol. 2022 Aug;235(3):1070-1081. doi: 10.1111/nph.18174. Epub 2022 May 11. New Phytol. 2022. PMID: 35460275 Free PMC article.
-
Transcriptomic and epigenomic analyses revealed that polycomb repressive complex 2 regulates not only developmental but also stress responsive metabolism in Brassica rapa.Front Plant Sci. 2023 Feb 20;14:1079218. doi: 10.3389/fpls.2023.1079218. eCollection 2023. Front Plant Sci. 2023. PMID: 36890886 Free PMC article.
References
-
- Birve A, Sengupta AK, Beuchle D, Larsson J, Kennison JA, et al. Su(z)12, a novel Drosophila Polycomb group gene that is conserved in vertebrates and plants. Development. 2001;128:3371–3379. - PubMed
-
- Gaudin V, Libault M, Pouteau S, Juul T, Zhao G, et al. Mutations in LIKE HETEROCHROMATIN PROTEIN 1 affect flowering time and plant architecture in Arabidopsis . Development. 2001;128:4847–4858. - PubMed
Publication types
MeSH terms
Substances
Associated data
- Actions
Grants and funding
LinkOut - more resources
Full Text Sources
Other Literature Sources
Molecular Biology Databases
Research Materials
