Diagnosis of suspicious breast lesions using an empirical mathematical model for dynamic contrast-enhanced MRI
- PMID: 17540270
- PMCID: PMC2925253
- DOI: 10.1016/j.mri.2006.10.011
Diagnosis of suspicious breast lesions using an empirical mathematical model for dynamic contrast-enhanced MRI
Abstract
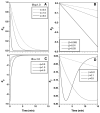
The purpose of this study was to test whether an empirical mathematical model (EMM) of dynamic contrast-enhanced magnetic resonance imaging (DCE-MRI) can distinguish between benign and malignant breast lesions. A modified clinical protocol was used to improve the sampling of contrast medium uptake and washout. T(1)-weighted DCE magnetic resonance images were acquired at 1.5 T for 22 patients before and after injection of Gd-DTPA. Contrast medium concentration as a function of time was calculated over a small region of interest containing the most rapidly enhancing pixels. Then the curves were fitted with the EMM, which accurately described contrast agent uptake and washout. Results demonstrate that benign lesions had uptake (P<2.0 x 10(-5)) and washout (P<.01) rates of contrast agent significantly slower than those of malignant lesions. In addition, secondary diagnostic parameters, such as time to peak of enhancement, enhancement slope at the peak and curvature at the peak of enhancement, were derived mathematically from the EMM and expressed in terms of primary parameters. These diagnostic parameters also effectively differentiated benign from malignant lesions (P<.03). Conventional analysis of contrast medium dynamics, using a subjective classification of contrast medium kinetics in lesions as "washout," "plateau" or "persistent" (sensitivity=83%, specificity=50% and diagnostic accuracy=72%), was less effective than the EMM (sensitivity=100%, specificity=83% and diagnostic accuracy=94%) for the separation of benign and malignant lesions. In summary, the present research suggests that the EMM is a promising alternative method for evaluating DCE-MRI data with improved diagnostic accuracy.
Figures

Similar articles
-
Differentiation between benign and malignant breast lesions detected by bilateral dynamic contrast-enhanced MRI: a sensitivity and specificity study.Magn Reson Med. 2008 Apr;59(4):747-54. doi: 10.1002/mrm.21530. Magn Reson Med. 2008. PMID: 18383287 Free PMC article.
-
Automatic identification and classification of characteristic kinetic curves of breast lesions on DCE-MRI.Med Phys. 2006 Aug;33(8):2878-87. doi: 10.1118/1.2210568. Med Phys. 2006. PMID: 16964864
-
MRI-detected suspicious breast lesions: predictive values of kinetic features measured by computer-aided evaluation.AJR Am J Roentgenol. 2009 Sep;193(3):826-31. doi: 10.2214/AJR.08.1335. AJR Am J Roentgenol. 2009. PMID: 19696298
-
Ultrafast Dynamic Contrast-enhanced MRI of the Breast: How Is It Used?Magn Reson Med Sci. 2022 Mar 1;21(1):83-94. doi: 10.2463/mrms.rev.2021-0157. Epub 2022 Feb 25. Magn Reson Med Sci. 2022. PMID: 35228489 Free PMC article. Review.
-
Dynamic MR imaging and radiotherapy.Magn Reson Med Sci. 2002;1(1):32-7. doi: 10.2463/mrms.1.32. Magn Reson Med Sci. 2002. PMID: 16037666 Review.
Cited by
-
An empirical mathematical model applied to quantitative evaluation of thioacetamide-induced acute liver injury in rats by use of dynamic contrast-enhanced computed tomography.Radiol Phys Technol. 2013 Jan;6(1):115-20. doi: 10.1007/s12194-012-0177-y. Epub 2012 Sep 19. Radiol Phys Technol. 2013. PMID: 22990839
-
MRI-based assessment of liver perfusion and hepatocyte injury in the murine model of acute hepatitis.MAGMA. 2016 Dec;29(6):789-798. doi: 10.1007/s10334-016-0563-2. Epub 2016 May 9. MAGMA. 2016. PMID: 27160299 Free PMC article.
-
Dynamic Contrast-Enhanced Magnetic Resonance Imaging as a Pharmacodynamic Biomarker for Pazopanib in Metastatic Renal Carcinoma.Clin Genitourin Cancer. 2017 Apr;15(2):207-212. doi: 10.1016/j.clgc.2016.08.011. Epub 2016 Aug 17. Clin Genitourin Cancer. 2017. PMID: 27634566 Free PMC article. Clinical Trial.
-
Differentiation between benign and malignant breast lesions detected by bilateral dynamic contrast-enhanced MRI: a sensitivity and specificity study.Magn Reson Med. 2008 Apr;59(4):747-54. doi: 10.1002/mrm.21530. Magn Reson Med. 2008. PMID: 18383287 Free PMC article.
-
The magnetic susceptibility effect of gadolinium-based contrast agents on PRFS-based MR thermometry during thermal interventions.J Ther Ultrasound. 2013 Jun 4;1:8. doi: 10.1186/2050-5736-1-8. eCollection 2013. J Ther Ultrasound. 2013. PMID: 25516799 Free PMC article.
References
-
- Goscin CP, Berman CG, Clark RA. Magnetic resonance imaging of the breast. Cancer Control. 2001;8:399–406. - PubMed
-
- Orel SG, Schnall MD. MR imaging of the breast for the detection, diagnosis, and staging of breast cancer. Radiology. 2001;220:13–30. - PubMed
-
- Brix G, Kiessling F, Lucht R, Darai S, Wasser K, Delorme S, et al. Microcirculation and microvasculature in breast tumors: pharmacokinetic analysis of dynamic MR image series. Magn Reson Med. 2004;52:420–9. - PubMed
-
- Orel SG. MR imaging of the breast. Radiol Clin North Am. 2000;38:899–913. - PubMed
-
- Rankin SC. MRI of the breast. Br J Radiol. 2000;73:806–18. - PubMed
Publication types
MeSH terms
Substances
Grants and funding
LinkOut - more resources
Full Text Sources
Other Literature Sources
Medical

