Formation of ceramide/sphingomyelin gel domains in the presence of an unsaturated phospholipid: a quantitative multiprobe approach
- PMID: 17496019
- PMCID: PMC1948048
- DOI: 10.1529/biophysj.107.107714
Formation of ceramide/sphingomyelin gel domains in the presence of an unsaturated phospholipid: a quantitative multiprobe approach
Abstract
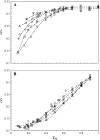
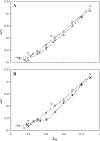
To better understand how ceramide modulates the biophysical properties of the membrane, the interactions between palmitoyl-ceramide (PCer) and palmitoyl-sphingomyelin (PSM) were studied in the presence of the fluid phospholipid palmitoyl-oleoyl-phosphatidylcholine (POPC) in membrane model systems. The use of two fluorescent membrane probes distinctly sensitive to lipid phases allowed a thorough biophysical characterization of the ternary system. In these mixtures, PCer recruits POPC and PSM in the fluid phase to form extremely ordered and compact gel domains. Gel domain formation by low PCer mol fraction (up to 12 mol %) is enhanced by physiological PSM levels (approximately 20-30 mol % total lipid). For higher PSM content, a three-phase situation, consisting of fluid (POPC-rich)/gel (PSM-rich)/gel (PCer-rich) coexistence, is clearly shown. To determine the fraction of each phase a quantitative method was developed. This allowed establishing the complete ternary phase diagram, which helps to predict PCer-rich gel domain formation and explains its enhancement through PSM/PCer interactions.
Figures


Similar articles
-
Ceramide-domain formation and collapse in lipid rafts: membrane reorganization by an apoptotic lipid.Biophys J. 2007 Jan 15;92(2):502-16. doi: 10.1529/biophysj.106.091876. Epub 2006 Oct 20. Biophys J. 2007. PMID: 17056734 Free PMC article.
-
Palmitoyl ceramide promotes milk sphingomyelin gel phase domains formation and affects the mechanical properties of the fluid phase in milk-SM/DOPC supported membranes.Biochim Biophys Acta Biomembr. 2018 Mar;1860(3):635-644. doi: 10.1016/j.bbamem.2017.12.005. Epub 2017 Dec 8. Biochim Biophys Acta Biomembr. 2018. PMID: 29229528
-
Lateral Segregation of Palmitoyl Ceramide-1-Phosphate in Simple and Complex Bilayers.Biophys J. 2019 Jul 9;117(1):36-45. doi: 10.1016/j.bpj.2019.05.015. Epub 2019 May 21. Biophys J. 2019. PMID: 31133285 Free PMC article.
-
Ceramide: a simple sphingolipid with unique biophysical properties.Prog Lipid Res. 2014 Apr;54:53-67. doi: 10.1016/j.plipres.2014.01.004. Epub 2014 Feb 7. Prog Lipid Res. 2014. PMID: 24513486 Review.
-
Enantiomers of phospholipids and cholesterol: A key to decipher lipid-lipid interplay in membrane.Chirality. 2020 Mar;32(3):282-298. doi: 10.1002/chir.23171. Epub 2020 Jan 16. Chirality. 2020. PMID: 31944412 Review.
Cited by
-
Effect of Cisplatin and Its Cationic Analogues in the Phase Behavior and Permeability of Model Lipid Bilayers.Mol Pharm. 2023 Feb 6;20(2):918-928. doi: 10.1021/acs.molpharmaceut.2c00321. Epub 2023 Jan 26. Mol Pharm. 2023. PMID: 36700695 Free PMC article.
-
Cholesterol-rich fluid membranes solubilize ceramide domains: implications for the structure and dynamics of mammalian intracellular and plasma membranes.J Biol Chem. 2009 Aug 21;284(34):22978-87. doi: 10.1074/jbc.M109.026567. Epub 2009 Jun 11. J Biol Chem. 2009. PMID: 19520848 Free PMC article.
-
Gel domains in the plasma membrane of Saccharomyces cerevisiae: highly ordered, ergosterol-free, and sphingolipid-enriched lipid rafts.J Biol Chem. 2011 Feb 18;286(7):5043-54. doi: 10.1074/jbc.M110.154435. Epub 2010 Dec 2. J Biol Chem. 2011. PMID: 21127065 Free PMC article.
-
Structure of ceramide-1-phosphate at the air-water solution interface in the absence and presence of Ca2+.Biophys J. 2009 Mar 18;96(6):2204-15. doi: 10.1016/j.bpj.2008.11.062. Biophys J. 2009. PMID: 19289047 Free PMC article.
-
Methylation of glycosylated sphingolipid modulates membrane lipid topography and pathogenicity of Cryptococcus neoformans.Cell Microbiol. 2012 Apr;14(4):500-16. doi: 10.1111/j.1462-5822.2011.01735.x. Epub 2012 Jan 9. Cell Microbiol. 2012. PMID: 22151739 Free PMC article.
References
-
- Simons, K., and E. Ikonen. 1997. Functional rafts in cell membranes. Nature. 387:569–572. - PubMed
-
- Simons, K., and D. Toomre. 2000. Lipid rafts and signal transduction. Nat. Rev. Mol. Cell Biol. 1:31–39. - PubMed
-
- Anderson, R. G. W., and K. Jacobson. 2002. Cell biology: a role for lipid shells in targeting proteins to caveolae, rafts, and other lipid domains. Science. 296:1821–1825. - PubMed
-
- Kusumi, A., C. Nakada, K. Ritchie, K. Murase, K. Suzuki, H. Murakoshi, R. S. Kasai, J. Kondo, and T. Fujiwara. 2005. Paradigm shift of the plasma membrane concept from the two-dimensional continuum fluid to the partitioned fluid: high-speed single-molecule tracking of membrane molecules. Annu. Rev. Biophys. Biomol. Struct. 34:351–358. - PubMed
Publication types
MeSH terms
Substances
LinkOut - more resources
Full Text Sources
Miscellaneous

