. 2007 Jun;8(6):702-17.
doi: 10.1111/j.1600-0854.2007.00565.x. Epub 2007 Apr 25.

Cholesterol-sensitive Cdc42 activation regulates actin polymerization for endocytosis via the GEEC pathway

Affiliations

Cholesterol-sensitive Cdc42 activation regulates actin polymerization for endocytosis via the GEEC pathway

Rahul Chadda et al. Traffic. 2007 Jun.

Abstract

Glycosyl-phosphatidylinositol (GPI)-anchored proteins (GPI-APs) are present at the surface of living cells in cholesterol dependent nanoscale clusters. These clusters appear to act as sorting signals for the selective endocytosis of GPI-APs via a Cdc42-regulated, dynamin and clathrin-independent pinocytic pathway called the GPI-AP-enriched early endosomal compartments (GEECs) pathway. Here we show that endocytosis via the GEECs pathway is inhibited by mild depletion of cholesterol, perturbation of actin polymerization or overexpression of the Cdc42/Rac-interactive-binding (CRIB) motif of neural Wiskott-Aldrich syndrome protein (N-WASP). Consistent with the involvement of Cdc42-based actin nanomachinery, nascent endocytic vesicles containing cargo for the GEEC pathway co-localize with fluorescent protein-tagged isoforms of Cdc42, CRIB domain, N-WASP and actin; high-resolution electron microscopy on plasma membrane sheets reveals Cdc42-labelled regions rich in green fluorescent protein-GPI. Using total internal reflection fluorescence microscopy at the single-molecule scale, we find that mild cholesterol depletion alters the dynamics of actin polymerization at the cell surface by inhibiting Cdc42 activation and consequently its stabilization at the cell surface. These results suggest that endocytosis into GEECs occurs through a cholesterol-sensitive, Cdc42-based recruitment of the actin polymerization machinery.


Figures
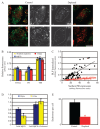
Figure 1
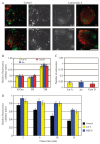
Figure 1. Depletion of cholesterol from cells blocks endocytosis via the GEEC pathway of endocytosis.
A) Control (left panels) or cholesterol-depleted (metabolic treatment; right panels) FR-GPI-expressing (FRαTb) CHO cells were incubated for 2 min at 37°C with either A568-Tf and PLF (top panel) or A568-Tf and F-Dex (green) (lower panel), washed, fixed and imaged on high-resolution wide-field microscope. Grayscale images of PLF/F-Dex (green) and A568-Tf-labelled TfR (red)-containing structures were pseudocoloured and colour merged. Scale bar, 10 μm. B) Histogram shows the extent of uptake (5 min) in cells depleted of cholesterol relative to control cells (set to 1), for indicated endocytic tracers [R-Dex, PLF (FR-GPI) and A568-Tf (TfR)]. Cholesterol was depleted via metabolic depletion (yellow bar), of treatment with MβCD (blue) or filipin (red). Values are wt. mean ± SEM obtained across three to five experiments each. C) Scatter plot shows uptake of FR-GPI determined by PLF fluorescence, after a 5-min pulse in control (filled circles) and metabolically depleted cells (open circles) plotted against the respective surface expression of FR-GPI (as marked by PLR). Similar data were obtained from three independent experiments. D) Histogram shows the extent of filipin staining and fluid uptake in cholesterol-depleted and cholesterol-replenished cells, expressed relative to control cells (value of controls set to 1). Cells were treated with 2 mM MβCD for 30 min. Cholesterol was replenished in depleted cells by incubating them with 2 mM MβCD–cholesterol complexes. Control, depleted and replenished cells were stained with filipin to ascertain changes in cholesterol level. Error bars represent wt. mean ± SEM. E) Histogram shows the number of GEECs as marked by PLF and TMR-dextran uptake after a 2-min pulse in control (black bar) and cholesterol-depleted cells (red bar). Bars represented are wt. mean ± SEM obtained across two experiments.
Figure 2
Figure 2. Inhibition of dynamic actin assembly or disassembly blocks endocytic uptake via the GEEC pathway.
A) Control (right panel) or Lat A-treated (left panel) FRαTb cells were incubated for 2 min at 37°C with either A568-Tf and PLF (top panel) or A568-Tf and FITC-dextran (lower panel) and imaged at high resolution. Grayscale images of PLF/FITC-dextran (green) and A568-Tf-labelled TfR (red)-containing structures were pseudocoloured and colour merged. Scale bar, 10 μm. B) Histogram shows the extent of uptake after a 5-min pulse of the indicated endocytic tracers in cells subject to Lat A, Jas or Cyto D treatment as described in Materials and Methods, expressed relative to that measured in control cells (value of controls set to 1). Values represented are wt. mean ± SEM obtained across three experiments. C) Histogram shows the average number of GEECs estimated in cells treated with different actin poisons as compared with control cells (value of controls set to 1). Values represented are wt. mean ± SEM across two experiments. D) Histogram shows that regurgitation of fluid is inhibited upon depletion of cholesterol or treatment of cells with Lat A. FRαTb cells were treated with MβCD or Lat A or carrier and pulsed with F-Dex for 2 min and chased for indicated times. Cells were fixed and amount of probe associated with the cells was estimated. Fluid left after the chase was normalized to the amount internalized (initial uptake set to 1). Values represented are wt. mean ± SEM across two experiments.
Figure 3
Figure 3. Overexpression of CRIB domain of N-WASP inhibits endocytosis via GEEC pathway.
A) FRαTb cells transfected with GFP-CRIB (green; top panel) or full-length GFP-N-WASP (green; bottom panel) were pulsed with R-Dex (red), A647-Tf (blue) for 5 min at 37°C, and imaged at low magnification using a × 20, 0.75 NA objective. Note GFP-CRIB but not GFP-N-WASP-transfected cells show a reduction in fluid-phase uptake relative to non-transfected cells. Scale bar, 5 μm. B) Histogram shows the extent of uptake in a 5-min pulse of indicated endocytic tracers in cells overexpressing GFP-CRIB or GFP-N-WASP, relative to that in non-transfected cells (value of controls set to 1). Values represented are wt. mean ± SEM obtained across two independent experiments.
Figure 4
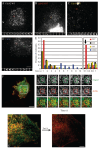
Figure 4. Nascent endocytic carriers co-localize with Cdc42, N-WASP and actin.
FRαTb cells expressing GFP-Cdc42 (B and G), GFP-N-WASP (C), actin–GFP (D), GFP-CRIB (E) or GFP-Cdc42-L61 (F) were pulsed with TMR-dextran (R-Dex; A–F) or A568-Tf (G) or A488-Tf (A) for 20 s at 37°C and rapidly washed, fixed and imaged under TIRF illumination (depth ∼100 nm). (H) Histogram shows the extent of co-localization of endosomes labelled with TMR-dextran (R-Dex) or A-Tf (TfR) with expressed GFP-tagged constructs, GFP-Cdc42 (WT), GFP-N-WASP (N-WASP), actin–GFP (actin), GFP-CRIB (CRIB) or GFP-Cdc42-L61 (L61). Extent of non-specific co-localization using the procedures in Materials and Methods is ∼3%. Data were obtained from 10–15 cells, threee to five experiments and represented as wt. mean ± SEM. Scale bar, 10 μm.
Figure 5
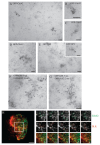
Figure 5. Ultrastructural localization of GFP–GPI and GFP-Cdc42 on plasma membrane.
A–G) BHK cells were transfected (A–E) or co-transfected (F–G) with GFP–GPI and/or GFP-Cdc42 as indicated. Cells were pulsed for 2 min with 5 nm anti-GFP-gold antibodies (E–G) prior to making membrane sheets. Membrane sheets were subsequently labelled with 5-nm anti-GFP-gold antibodies (A–E) or 2-nm anti-GFP-gold (F–G). GFP-Cdc42 is distributed over the entire surface but is concentrated in specific areas (arrowheads) as shown at higher magnification in (B) and (C). Note the elongated morphology of the labelled structures (B and C) and how gold particles can be seen to follow a membrane surface in places (e.g. B). In cells expressing higher levels of GFP-Cdc42, similarly sized clusters are still evident (D). Note GFP–GPI label is present over the entire surface (E) with discrete clusters evident in some areas of the cell surface (E, inset). Double labelling of co-transfected cells shows clusters containing both GFP–GPI (large arrowheads) and GFP-Cdc42 (small arrowheads; F and G). Scale bars, 100 nm. H) FRαTb cells were transfected with GFP-Cdc42 and labelled with PLR to mark FR-GPIs on cell surface. Cells were imaged live under dual colour TIRF illumination. Images were acquired at 1.5-s time interval. Montage (taken from Video S1) shows regions in GFP-Cdc42 and PLR image that co-localize with each other. Scale bar, 2 μm.
Figure 6
Figure 6. Single-molecule events of Cdc42 and CRIB domain of N-WASP.
A–D) FRαTb cells were transfected with GFP-Cdc42-WT, GFP-Cdc42-N17, GFP-Cdc42-L61 or GFP-CRIB DNA constructs, and only cells expressing very low levels of fusion protein were imaged under TIRF illumination with charge coupled device (CCD) cameras. Images and montage taken from videos (Video S4) show single molecules that dwell at a particular subresolution spot indicate long-lived spots in the case of Cdc42-WT and Cdc42-L61 GFP variants, while the GFP-Cdc42-N17 isoform appears only transiently on the membrane. Similarly, stabilized molecules are also demonstrated by GFP-CRIB albeit with long residence times (D). E) Histogram shows the distribution of residence times of Cdc42-WT, Cdc42-L61, Cdc42-N17 and GFP-CRIB DNA molecules on the plasma membrane. Note that a majority of N17 molecules reside for just 100 ms (one frame) in a video and residence time is similar to GFP molecules expressed in cytosol in the same cells (bold arrow); only a small fraction of trajectories exhibit any persistence, and even these show large diffusive trajectories (8–20 cells used for calculation. Each set repeated at least twice). F) FRαTb cells co-expressing Cherry-actin and GFP-Cdc42 were imaged live at 37°C under TIRF illumination, using sequential excitation of both probes. Images and the montage from a video (images were acquired at 1.5-s time; Video 2) show regions where Cdc42 and actin are co-enriched in small dynamic punctate structures. (Scale 10 μm). G) FRαTb cells were transfected with GFP-Cdc42 (green) and Cherry-actin (red) and imaged live, with two-colour TIR illumination (depth ∼100 nm). Cells were treated with Lat A, 4 μM for 2 min, and images of GFP-Cdc42 and PLR was collected before and after treatment. (Scale 5 μm).
Figure 7
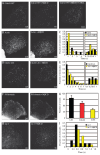
Figure 7. Cholesterol depletion perturbs the recruitment characteristics of Cdc42 and the dynamics of actin polymerization at the cell surface.
A–H) FRαTb cells transfected with GFP-Cdc42-WT, GFP-Cdc42-L61, actin–GFP, PH-GFP or GFP-Rac1 were imaged before and after MβCD treatment. A) The number of single-molecule events of GFP-Cdc42-WT decreases upon cholesterol depletion, which can be restored upon addition of cholesterol in depleted cells. C) Histogram shows the residence time of events before (black bars) and after (yellow bars) cholesterol depletion. B) Dynamics of actin decreases upon cholesterol depletion. D and E) L61 mutant of Cdc42 seems refractory to cholesterol depletion. Histogram shows that residence time of events remain unchanged. F, H and I) PH-GFP, Rac1 show little change in event number upon cholesterol depletion. y-Axis in all graphs (except G) denoted fraction of molecules and x-axis denotes the timescale in seconds. G) Histogram denotes the number of events in treated cases expressed relative to controls (wt. mean ± SEM from two to six experiments). Numbers written at right corner of images denote single molecule events recorded in that cell. Scale bar, 5 μm.

Similar articles

Cited by

References

    1. Conner SD, Schmid SL. Regulated portals of entry into the cell. Nature. 2003;422:37–44. - PubMed
    1. Mukherjee S, Ghosh RN, Maxfield FR. Endocytosis. Physiol Rev. 1997;77:759–803. - PubMed
    1. Donaldson J. Multiple roles for Arf6: Sorting, structuring and signaling at the plasma membrane. J Biol Chem. 2003;278:41573–41576. - PubMed
    1. Marsh M, Helenius A. Virus entry: open sesame. Cell. 2006;124:729–740. doi: 10.1016/j.cell.2006.02.007. - DOI - PMC - PubMed
    1. Damke H, Baba T, Warnock D, Schmid S. Induction of mutant dynamin specifically blocks endocytic coated vesicle formation. J Cell Biol. 1994;127:915–934. doi: 10.1083/jcb.127.4.915. - DOI - PMC - PubMed

Publication types

MeSH terms