. 2007 Apr 18;27(16):4273-82.
doi: 10.1523/JNEUROSCI.3477-06.2007.

Changes in Sef levels influence auditory brainstem development and function

Affiliations

Changes in Sef levels influence auditory brainstem development and function

Victoria E Abraira et al. J Neurosci. .

Abstract

During development of the CNS, secreted morphogens of the fibroblast growth factor (FGF) family have multiple effects on cell division, migration, and survival depending on where, when, and how much FGF signal is received. The consequences of misregulating the FGF pathway were studied in a mouse with decreased levels of the FGF antagonist Sef. To uncover effects in the nervous system, we focused on the auditory system, which is accessible to physiological analysis. We found that the mitogen-activated protein kinase pathway is active in the rhombic lip, a germinal zone that generates diverse types of neurons, including the cochlear nucleus complex of the auditory system. Sef is expressed immediately adjacent to the rhombic lip, overlapping with FGF15 and FGFR1, which is also present in the lip itself. This pattern suggests that Sef may normally function in non-rhombic lip cells and prevent them from responding to FGF ligand in the vicinity. Consistent with this idea, overexpression of Sef in chicks decreased the size of the auditory nuclei. Cochlear nucleus defects were also apparent in mice with reduced levels of Sef, with 13% exhibiting grossly dysmorphic cochlear nuclei and 26% showing decreased amounts of GFAP in the cochlear nucleus. Additional evidence for cochlear nucleus defects was obtained by electrophysiological analysis of Sef mutant mice, which have normal auditory thresholds but abnormal auditory brainstem responses. These results show both increases and decreases in Sef levels affect the assembly and function of the auditory brainstem.


Figures

Figure 1.
Figure 1.
Disruption of Sef in SefKST223 gene trap mutants. a, SefKST223 mice contain a gene trap vector resulting in a fusion of β-geo to Sef protein at the position indicated (Leighton et al., 2001; Mitchell et al., 2001). Primers specific for Sef-β-geo and for the 3′ end of Sef are indicated by arrows. SS, Signal sequence; TM, transmembrane domain; IL 17, interleukin 17; SA, splice acceptor. b, X-gal staining of an E10 SefKST223 heterozygous embryo. Sef–β-geo activity is seen in many regions of FGF signaling, including the mid-hindbrain junction (asterisk) and the ventral half of the otic vesicle (arrow). c, Reverse transcription-PCR of E14.5 RNA collected from wild-type (WT), heterozygous (Het), and mutant (Mut) embryos with primers specific for Sef shows a moderate decrease in Sef expression levels in heterozygous embryos and a strong decrease in mutants. Conversely, Sef-β-geo is present in heterozygotes and mutants but not wild types.
Figure 2.
Figure 2.
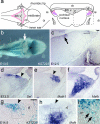
Sef is expressed in cells bordering the rhombic lip. a, Dorsal (left) and transverse (right) diagrammatic views of the rhombic lip (pink) in an E12–E14 mouse embryo. The transverse view is through the plane indicated (dashed line); the position of the inner ear provides a guide for the rostrocaudal position in the hindbrain. At the level of the inner ear, the cochlear nucleus complex (purple) develops immediately adjacent to the rhombic lip. Dashed boxes outline the regions that are shown in c and d–g. 4th v, Fourth ventricle; cb, cerebellum. b, Dorsal view of an E13.5 SefKST223 heterozygous embryo stained for β-galactosidase activity. Sef-β-geo is active in cells bordering the rim of the fourth ventricle, with intense activity (arrow) at the level of the inner ear, which has been dissected away. c, Transverse section of an E12.5 wild-type embryo hybridized with a probe to Sef. As indicated by X-gal staining, Sef is produced in a band of cells (bracket) adjacent to the rhombic lip and in a medial portion of the ventricular zone (arrow). d–f, Transverse adjacent sections through the E13.5 hindbrain hybridized with probes to Sef (d), Math1 (e), and Mafb (f). Sef is expressed adjacent to Math1 in the rhombic lip (arrowheads mark the lateral limit of Math1 expression) and abuts Mafb in the developing cochlear nucleus. g, h, Transverse semi-adjacent sections of an E14.5 SefKST223 heterozygous embryo stained for β-galactosidase activity (g) and hybridized with a probe to Mafb (h). As seen at earlier stages, β-galactosidase activity is detected in the Sef-positive region adjacent to the rhombic lip (rl) (arrowhead indicates boundary). In addition, weakly stained cells are present in the developing cochlear nucleus, as determined by the expression of Mafb on a semi-adjacent section (h). The dashed boxes correspond to the region shown in i. i, High-power view of the region boxed in g. A stream of stained cells with elongated morphology (arrows) appears to move from the Sef-positive region into the cochlear nucleus anlage (cn). Scale bars: c–g, 50 μm; i, 10 μm.
Figure 3.
Figure 3.
The FGF pathway is active in the rhombic lip. a–c, E14.5 wild-type tissue hybridized with probes to Sef (a), FGFR1 (b), and FGF15 (c). a and b are adjacent sections. Sef (bracket) overlaps with FGFR1 near the rhombic lip (arrowheads) and in the medial floor of the fourth ventricle (arrows). FGF15 is expressed at high levels near the rhombic lip, overlapping Sef (adjacent section not shown). d, An E14.5 SefKST223 heterozygote stained with antibodies to β-galactosidase (red) and phosphorylated Erk1/2 (pErk1/2; green). Phosphorylated Erk1/2-positive cells (arrows) are present in the rhombic lip (arrowheads) but not in the Sef-β-geo expression domain, indicating that the MAP kinase pathway is active in the rhombic lip itself. All sections are transverse and correspond to the regions outlined in Figure 2. Scale bars, 50 μm.
Figure 4.
Figure 4.
Overexpression of Sef inhibits auditory nucleus development in chicks. a, a', Bright-field (a) and fluorescent (a') lateral views of an E4 electroporated chick embryo at the level of the otic vesicle (asterisk). Rostral (r) is up and to the right; caudal (c) is down and to the left. eGFP expression can be seen at the level of the otic vesicle and extending rostrally and caudally (arrowheads). 4th v, Fourth ventricle. b, Transverse section through an eGFP-electroporated E4 chick embryo. Strongly labeled cells are present in the rhombic lip (arrowhead) and are also scattered throughout the neural tube, including commissural neurons that have extended axons toward the midline. Only the electroporated side is shown; no labeling is seen on the unelectroporated side. c–f, Coronal sections through control (c, e) and Sef-electroporated (d, f) embryos were hybridized with a probe to cMafb. In control embryos, cMafb is produced in NM medially and in NA laterally. cMafb is also expressed in the nucleus laminaris, which serves a function equivalent to the medial superior olive in mammals. In NA-affected embryos (d), NA is drastically reduced (arrow) on the electroporated side (asterisk), but NM is unaffected. In NM-affected embryos (f), NM is smaller on the electroporated side. Nucleus laminaris (NL) is variably affected, appearing to be shorter and slightly disorganized, but this phenotype was not robust enough to quantify. g, h, The area of NM (in square micrometers) was measured every 28 μm on both sides of the brainstem, moving from rostral to caudal regions (x-axis). Measurements are shown for the embryos depicted in e and f. In the control embryo (g), the area of NM is the same on the unelectroporated (blue) and electroporated (pink) sides. In the Sef-electroporated embryo (h), NM is smaller on the electroporated side in every section. i, Individual (filled symbols) and average (open symbols) NM and NA ratios for control-electroporated (blue) and Sef-electroporated (pink) embryos. The volumes of NM and NA on the electroporated side were compared with the volumes on the unelectroporated side, with a value of 1 predicted as normal. Error bars indicate SD. Although no control-electroporated embryos had volume ratios <0.8, six Sef-electroporated embryos fell outside this range for NM, and two fell outside this range for NA. D, Dorsal; V, ventral.
Figure 5.
Figure 5.
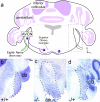
Cochlear nucleus defects in a subset of Sef mutant mice. a, Diagram of the mouse auditory brainstem. Information arrives from the inner ear via the eighth nerve. Spiral ganglion axons (green) connect to a variety of cell types in both divisions of the cochlear nuclei. A major population of neurons in AVCN (purple) projects to the superior olivary complex both ipsilaterally and contralaterally; other pathways are not shown. The dashed box indicates the region shown in b–d. D, Dorsal; L, lateral. b–d, A Nissl-stained section in the coronal plane through a wild-type brainstem (b) illustrates the normal anatomy of the cochlear nucleus. Abnormal morphology was observed bilaterally in one mutant (c) and unilaterally in one heterozygote (d). AVCN is misshapen and fails to separate from the surrounding tissue. The cerebellum has overgrown its normally free lateral edge (d). cb, Cerebellum; 8th n, eighth nerve. Scale bar, 100 μm.
Figure 6.
Figure 6.
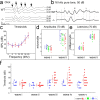
ABRs are abnormal in Sef mutant mice. a, ABRs from 12-week-old wild-type (WT; top) and homozygous (−/−; bottom) animals at 5 dB increments from 60 to 70 dB, click stimulus. Waves i–v are indicated. The mutant animal responds to sound, but the peaks are small, even at high SPLs. b, Representative traces from a wild-type (WT; top) and a homozygous (−/−; bottom) animal presented with a 16 kHz stimulus at 50 dB. The morphology of the late peaks is clearly abnormal in the SefKST223 mutant. The first two waves are distinct, but the later activity does not resolve into clearly identifiable waves. c, Average thresholds for wild-type (blue; n = 8 ears) and homozygous (red; n = 16 ears) animals presented with pure tone stimuli from 5 to 45 kHz. There is no change in threshold at any frequency. d, Amplitudes measured for waves i and ii in response to a 70 dB click stimulus. Individual responses are plotted with filled symbols, and average responses are plotted with open symbols. The average amplitude for both waves is significantly reduced in heterozygous (green; n = 16 ears) and homozygous (red; n = 13 ears) animals, with several animals exhibiting poor responses that fall well outside the wild-type (blue; n = 10 ears) range (*p < 0.05, ANOVA). e, Average latencies are unaffected in the same animals. f, The threshold for each peak was determined in wild-type (blue; n = 8 ears) and homozygous (red; n = 16 ears) animals presented with a 16 kHz stimulus. Waves i and ii occur at normal SPLs, but the later responses (iii–v) occur at significantly higher intensities in mutants compared with wild types (p < 0.02, ANOVA). Error bars indicate SD for each average.
Figure 7.
Figure 7.
Decreased GFAP levels in cochlear nucleus astrocytes in strongly affected SefKST223mutants. a, a', A coronal section through DCN from a P14 SefKST223 heterozygote double labeled for β-galactosidase activity (a) and antibodies to GFAP (a'). Sef-β-geo and GFAP have similar patterns of distribution, with intense expression in the molecular layer (arrows). b, Double labeling of a P17 SefKST223heterozygote with antibodies to TuJ1 (green) and β-galactosidase (β-gal; red) shows production of Sef-β-geo in small non-neuronal cells (arrows) in the molecular layer. c, c', Merged (c) and single channel (c') Z series projections of two astrocytes (arrows). Sef-β-geo (red) is present in a puncate pattern within the cytoplasm of GFAP-positive astrocytes (green). β-gal, β-Galactosidase. d–g, Anti-GFAP antibody labeling of coronal sections from a wild type (d, f) and a SefKST223 homozygote (e, g) through AVCN at the entry of the eighth nerve (8th n.). Dorsal (D) is up and to the left; lateral (L) is up and to the right. The dashed line indicates the boundary between the cochlear nucleus and the rest of the brainstem. The sections were processed and analyzed in parallel, using the same settings for image capture. High-power views of the granule cell layer are shown in f and g and correspond to the region boxed in d. In normal animals, GFAP staining is prominent in the microneuronal shell (arrows) and in the eighth nerve. Although GFAP continues to be expressed at high levels on the surface of the cochlear nucleus and in scattered cells (g, arrows), very little expression is seen in the microneuronal shell of a SefKST223 homozygote that had significantly elevated ABR thresholds in both ears (55 dB on the right and 80 dB on the left for wave iii). cb, Cerebellum. Scale bars: a, b, d, 40 μm; c, 5 μm; f, 10 μm.

Similar articles

Cited by

References

    1. Basson MA, Akbulut S, Watson-Johnson J, Simon R, Carroll TJ, Shakya R, Gross I, Martin GR, Lufkin T, McMahon AP, Wilson PD, Costantini FD, Mason IJ, Licht JD. Sprouty1 is a critical regulator of GDNF/RET-mediated kidney induction. Dev Cell. 2005;8:229–239. - PubMed
    1. Cramer KS, Fraser SE, Rubel EW. Embryonic origins of auditory brainstem nuclei in the chick hindbrain. Dev Biol. 2000;224:138–151. - PubMed
    1. Cramer KS, Bermingham-McDonogh O, Krull CE, Rubel EW. EphA4 signaling promotes axon segregation in the developing auditory system. Dev Biol. 2004;269:26–35. - PubMed
    1. Cramer KS, Cerretti DP, Siddiqui SA. EphB2 regulates axonal growth at the midline in the developing auditory brainstem. Dev Biol. 2006;295:76–89. - PubMed
    1. Darby S, Sahadevan K, Khan MM, Robson CN, Leung HY, Gnanapragasam VJ. Loss of Sef (similar expression to FGF) expression is associated with high grade and metastatic prostate cancer. Oncogene. 2006;25:4122–4127. - PubMed

Publication types

MeSH terms

LinkOut - more resources