

Independent vasomotor control of rat tail and proximal hairy skin
- PMID: 17430987
- PMCID: PMC2075273
- DOI: 10.1113/jphysiol.2007.131292
Independent vasomotor control of rat tail and proximal hairy skin
Abstract
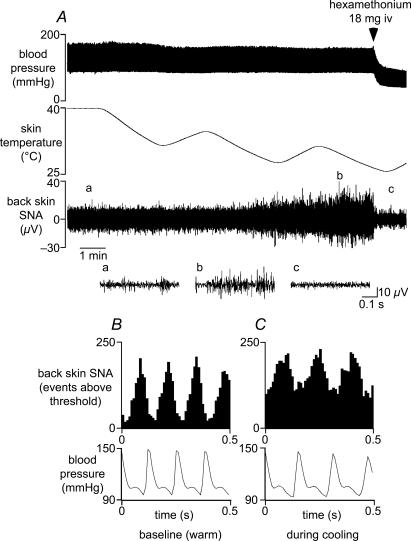
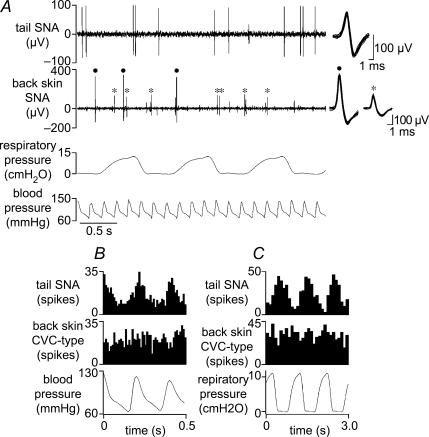
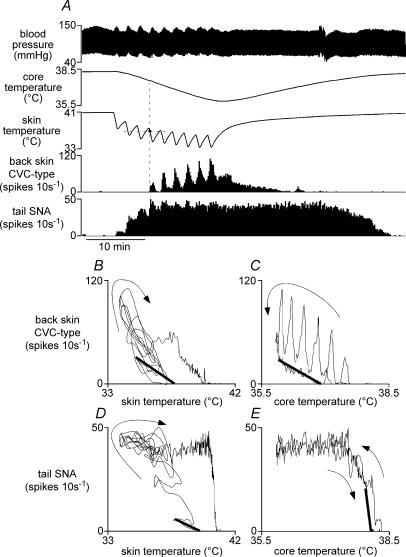
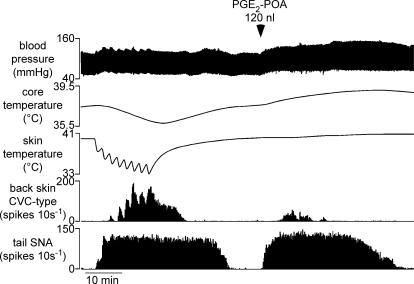
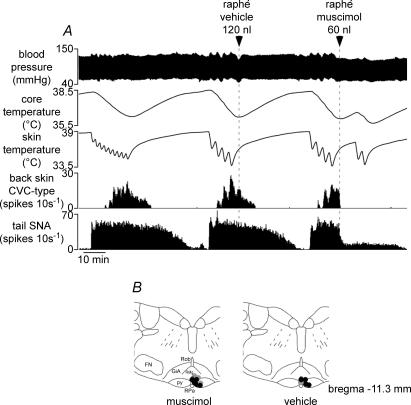
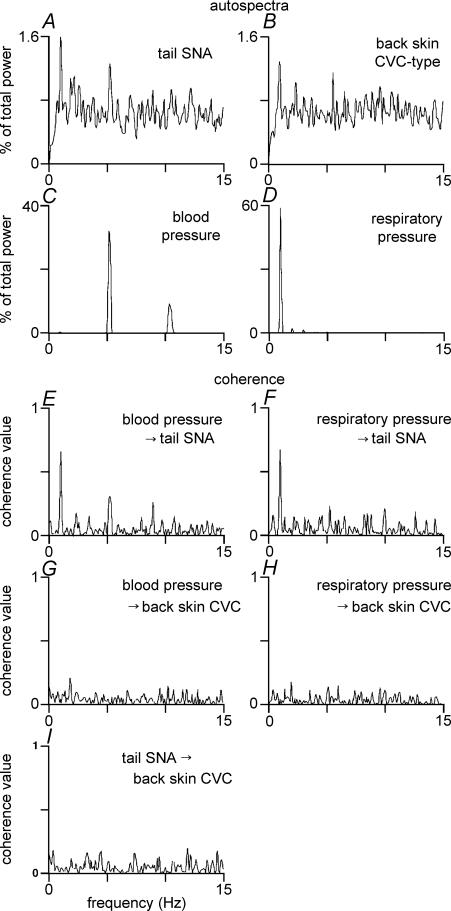
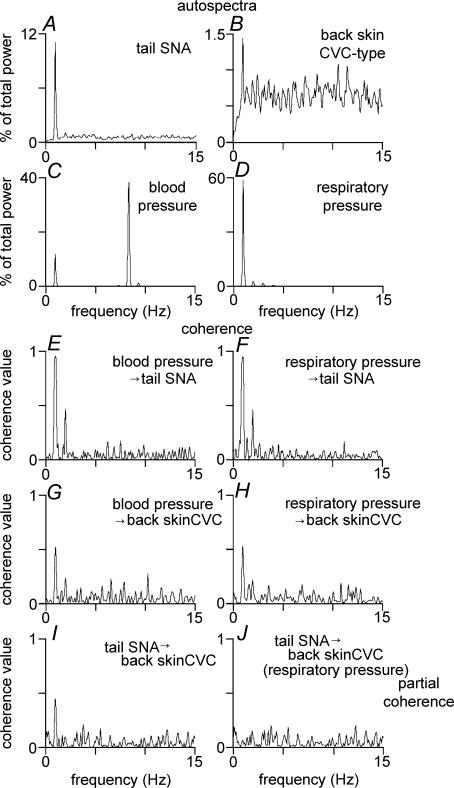
Quantitative differences are known to exist between the vasomotor control of hairy and hairless skin, but it is unknown whether they are regulated by common central mechanisms. We made simultaneous recordings from sympathetic cutaneous vasoconstrictor (CVC-type) fibres supplying back skin (hairy) and tail (hairless) in urethane-anaesthetized, artificially ventilated rats. The animal's trunk was shaved and encased in a water-perfused jacket. Both tail and back skin CVC-type fibres were activated by cooling the trunk skin, and independently by the resultant fall in core (rectal) temperature, but their thresholds for activation differed (skin temperatures 38.8 +/- 0.4 degrees C versus 36.8 +/- 0.4 degrees C, core temperatures 38.1 +/- 0.2 degrees C versus 36.8 +/- 0.2 degrees C, respectively; P < 0.01). Back skin CVC-type fibres were more responsive to skin than to core cooling, while the reverse applied to tail fibres. Back skin CVC-type fibres were less responsive than tail fibres to prostaglandin E2 (PGE2) microinjected into the preoptic area. Spectral analysis showed no significant coherence between tail and back skin CVC-type fibre activities during cooling. After preoptic PGE2 injection, a coherent peak at 1 Hz appeared in some animals; this disappeared after partialization with respect to ventilatory pressure, indicating that it was attributable to common ventilatory modulation. Neuronal inhibition in the rostral medullary raphé by microinjected muscimol (2 mM, 60-120 nl) suppressed both tail and back skin CVC-type fibre activities, and prevented their responses to subsequent skin cooling. These results indicate that thermoregulatory responses of hairless and hairy skin vessels are controlled by independent neural pathways, although both depend on synaptic relays in the medullary raphé.
Figures

Similar articles
-
Inhibition of rostral medullary raphé neurons prevents cold-induced activity in sympathetic nerves to rat tail and rabbit ear arteries.Neurosci Lett. 2004 Feb 26;357(1):58-62. doi: 10.1016/j.neulet.2003.11.067. Neurosci Lett. 2004. PMID: 15036613
-
Rostral ventromedial medulla and the control of cutaneous vasoconstrictor activity following i.c.v. prostaglandin E(1).Neuroscience. 2004;124(3):709-17. doi: 10.1016/j.neuroscience.2003.12.019. Neuroscience. 2004. PMID: 14980740
-
Cold-activated raphé-spinal neurons in rats.J Physiol. 2001 Sep 15;535(Pt 3):841-54. doi: 10.1111/j.1469-7793.2001.t01-1-00841.x. J Physiol. 2001. PMID: 11559779 Free PMC article.
-
Multiple thermoregulatory effectors with independent central controls.Eur J Appl Physiol. 2010 May;109(1):27-33. doi: 10.1007/s00421-009-1295-z. Epub 2009 Dec 1. Eur J Appl Physiol. 2010. PMID: 19949811 Review.
-
Cutaneous vasodilator and vasoconstrictor mechanisms in temperature regulation.Compr Physiol. 2014 Jan;4(1):33-89. doi: 10.1002/cphy.c130015. Compr Physiol. 2014. PMID: 24692134 Review.
Cited by
-
Short of air? Cool it!J Physiol. 2009 Nov 1;587(Pt 21):5009-10. doi: 10.1113/jphysiol.2009.181982. J Physiol. 2009. PMID: 19880875 Free PMC article. No abstract available.
-
Skin temperature: its role in thermoregulation.Acta Physiol (Oxf). 2014 Mar;210(3):498-507. doi: 10.1111/apha.12231. Acta Physiol (Oxf). 2014. PMID: 24716231 Free PMC article. Review.
-
Activation of neurokinin 3 receptors in the median preoptic nucleus decreases core temperature in the rat.Endocrinology. 2011 Dec;152(12):4894-905. doi: 10.1210/en.2011-1492. Epub 2011 Oct 25. Endocrinology. 2011. PMID: 22028440 Free PMC article.
-
Orexins and the cardiovascular events of awakening.Temperature (Austin). 2017 Feb 16;4(2):128-140. doi: 10.1080/23328940.2017.1295128. eCollection 2017. Temperature (Austin). 2017. PMID: 28680929 Free PMC article. Review.
-
Reflex control of rat tail sympathetic nerve activity by abdominal temperature.Temperature (Austin). 2014 Jun 24;1(1):37-41. doi: 10.4161/temp.29597. eCollection 2014 Apr-Jun. Temperature (Austin). 2014. PMID: 27583279 Free PMC article.
References
-
- Barman SM, Gebber GL. Subgroups of rostral ventrolateral medullary and caudal medullary raphe neurons based on patterns of relationship to sympathetic nerve discharge and axonal projections. J Neurophysiol. 1997;77:65–75. - PubMed
-
- Boczek-Funcke A, Häbler HJ, Jänig W, Michaelis M. Rapid phasic baroreceptor inhibition of the activity in sympathetic preganglionic neurones does not change throughout the respiratory cycle. J Auton Nerv Syst. 1991;34:185–194. - PubMed
-
- Boden AG, Harris MC, Parkes MJ. A respiratory drive in addition to the increase in CO2 production at raised body temperature in rats. Exp Physiol. 2000;85:309–319. - PubMed
-
- Bonaz B, Taché Y. Induction of Fos immunoreactivity in the rat brain after cold-restraint induced gastric lesions and fecal excretion. Brain Res. 1994;652:56–64. - PubMed
Publication types
MeSH terms
Substances
LinkOut - more resources
Full Text Sources