Down-regulation of tristetraprolin expression results in enhanced IL-12 and MIP-2 production and reduced MIP-3alpha synthesis in activated macrophages
- PMID: 17392586
- PMCID: PMC1775030
- DOI: 10.1155/MI/2006/40691
Down-regulation of tristetraprolin expression results in enhanced IL-12 and MIP-2 production and reduced MIP-3alpha synthesis in activated macrophages
Abstract
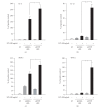
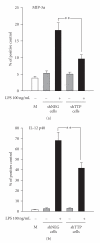
In inflammation, the post-transcriptional regulation of transiently expressed genes provides a potential therapeutic target. Tristetraprolin (TTP) is of the factors regulating decay of cytokine mRNAs. The aim of the present study was to identify cytokines whose expression is regulated by TTP. We established a TTP knock-down cell line by expressing shRNA against TTP (shTTP cell line). A cytokine antibody array was used to measure cytokine production in macrophages exposed to lipopolysaccharide (LPS). Cytokines IL-6, IL-12, TNF-alpha, and MIP-2 (a homologue to human IL-8) were expressed at higher levels whereas MIP-3alpha was produced at lower levels in LPS-treated shTTP cells than in control cells suggesting that the expression of these cytokines is regulated by TTP. The present data provide IL-12, MIP-2, and MIP-3alpha as novel inflammatory cytokine targets for TTP-mediated mRNA decay and stress the role of TTP in the regulation of the inflammatory process.
Figures


Similar articles
-
Chemokine expression in human erythroid leukemia cell line AS-E2: macrophage inflammatory protein-3alpha/CCL20 is induced by inflammatory cytokines.Exp Hematol. 2006 Jan;34(1):19-26. doi: 10.1016/j.exphem.2005.09.012. Exp Hematol. 2006. PMID: 16413387
-
A functional role for interleukin-21 in promoting the synthesis of the T-cell chemoattractant, MIP-3alpha, by gut epithelial cells.Gastroenterology. 2007 Jan;132(1):166-75. doi: 10.1053/j.gastro.2006.09.053. Epub 2006 Oct 1. Gastroenterology. 2007. PMID: 17241869
-
Inhibition of protein kinase Cdelta reduces tristetraprolin expression by destabilizing its mRNA in activated macrophages.Eur J Pharmacol. 2010 Feb 25;628(1-3):220-5. doi: 10.1016/j.ejphar.2009.11.014. Epub 2009 Nov 17. Eur J Pharmacol. 2010. PMID: 19925787
-
Macrophage inflammatory proteins: biology and role in pulmonary inflammation.Exp Lung Res. 1994 Nov-Dec;20(6):473-90. doi: 10.3109/01902149409031733. Exp Lung Res. 1994. PMID: 7882902 Review.
-
The Cross-talk between Tristetraprolin and Cytokines in Cancer.Anticancer Agents Med Chem. 2017 Nov 24;17(11):1477-1486. doi: 10.2174/1871520617666170327155124. Anticancer Agents Med Chem. 2017. PMID: 28356023 Review.
Cited by
-
IL-35 is a novel responsive anti-inflammatory cytokine--a new system of categorizing anti-inflammatory cytokines.PLoS One. 2012;7(3):e33628. doi: 10.1371/journal.pone.0033628. Epub 2012 Mar 16. PLoS One. 2012. PMID: 22438968 Free PMC article.
-
Suppression of IL-12 production by tristetraprolin through blocking NF-kcyB nuclear translocation.J Immunol. 2013 Oct 1;191(7):3922-30. doi: 10.4049/jimmunol.1300126. Epub 2013 Aug 30. J Immunol. 2013. PMID: 23997224 Free PMC article.
-
Tristetraprolin-driven regulatory circuit controls quality and timing of mRNA decay in inflammation.Mol Syst Biol. 2011 Dec 20;7:560. doi: 10.1038/msb.2011.93. Mol Syst Biol. 2011. PMID: 22186734 Free PMC article.
-
The role of tristetraprolin in cancer and inflammation.Front Biosci (Landmark Ed). 2012 Jan 1;17(1):174-88. doi: 10.2741/3920. Front Biosci (Landmark Ed). 2012. PMID: 22201737 Free PMC article. Review.
-
Role of Tristetraprolin in the Resolution of Inflammation.Biology (Basel). 2021 Jan 19;10(1):66. doi: 10.3390/biology10010066. Biology (Basel). 2021. PMID: 33477783 Free PMC article. Review.
References
-
- Varnum BC, Lim RW, Sukhatme VP, Herschman HR. Nucleotide sequence of a cDNA encoding TIS11, a message induced in Swiss 3T3 cells by the tumor promoter tetradecanoyl phorbol acetate. Oncogene. 1989;4(1):119–120. - PubMed
-
- Lai WS, Stumpo DJ, Blackshear PJ. Rapid insulin-stimulated accumulation of an mRNA encoding a proline-rich protein. Journal of Biological Chemistry. 1990;265(27):16556–16563. - PubMed
-
- DuBois RN, McLane MW, Ryder K, Lau LF, Nathans D. A growth factor-inducible nuclear protein with a novel cysteine/histidine repetitive sequence. Journal of Biological Chemistry. 1990;265(31):19185–19191. - PubMed
-
- Ma Q, Herschman HR. A corrected sequence for the predicted protein from the mitogen-inducible TIS11 primary response gene. Oncogene. 1991;6(7):1277–1278. - PubMed
Publication types
MeSH terms
Substances
LinkOut - more resources
Full Text Sources

