Identification of a new intrinsically timed developmental checkpoint that reprograms key hematopoietic stem cell properties
- PMID: 17379664
- PMCID: PMC1829493
- DOI: 10.1073/pnas.0700460104
Identification of a new intrinsically timed developmental checkpoint that reprograms key hematopoietic stem cell properties
Abstract
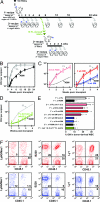
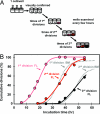
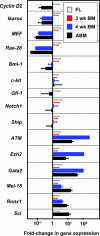
Hematopoietic stem cells (HSCs) execute self-renewal divisions throughout fetal and adult life, although some of their properties do alter. Here we analyzed the magnitude and timing of changes in the self-renewal properties and differentiated cell outputs of transplanted HSCs obtained from different sources during development. We also assessed the expression of several "stem cell" genes in corresponding populations of highly purified HSCs. Fetal and adult HSCs displayed marked differences in their self-renewal, differentiated cell output, and gene expression properties, with persistence of a fetal phenotype until 3 weeks after birth. Then, 1 week later, the HSCs became functionally indistinguishable from adult HSCs. The same schedule of changes in HSC properties occurred when HSCs from fetal or 3-week-old donors were transplanted into adult recipients. These findings point to the existence of a previously unrecognized, intrinsically regulated master switch that effects a developmental change in key HSC properties.
Conflict of interest statement
The authors declare no conflict of interest.
Figures


Similar articles
-
Circulation and chemotaxis of fetal hematopoietic stem cells.PLoS Biol. 2004 Mar;2(3):E75. doi: 10.1371/journal.pbio.0020075. Epub 2004 Mar 16. PLoS Biol. 2004. PMID: 15024423 Free PMC article.
-
Deterministic regulation of hematopoietic stem cell self-renewal and differentiation.Blood. 2002 Aug 15;100(4):1302-9. Blood. 2002. PMID: 12149211
-
Nitric oxide has contrasting age-dependent effects on the functionality of murine hematopoietic stem cells.Stem Cell Res Ther. 2016 Nov 22;7(1):171. doi: 10.1186/s13287-016-0433-x. Stem Cell Res Ther. 2016. PMID: 27876094 Free PMC article.
-
Divisional history and pluripotency of human hematopoietic stem cells.Ann N Y Acad Sci. 2001 Jun;938:72-81; discussion 81-2. doi: 10.1111/j.1749-6632.2001.tb03576.x. Ann N Y Acad Sci. 2001. PMID: 11458528 Review.
-
Dormant and self-renewing hematopoietic stem cells and their niches.Ann N Y Acad Sci. 2007 Jun;1106:64-75. doi: 10.1196/annals.1392.021. Epub 2007 Apr 18. Ann N Y Acad Sci. 2007. PMID: 17442778 Review.
Cited by
-
Lessons from early life: understanding development to expand stem cells and treat cancers.Development. 2022 Oct 15;149(20):dev201070. doi: 10.1242/dev.201070. Epub 2022 Oct 11. Development. 2022. PMID: 36217963 Free PMC article. Review.
-
Aging is associated with functional and molecular changes in distinct hematopoietic stem cell subsets.Nat Commun. 2024 Sep 11;15(1):7966. doi: 10.1038/s41467-024-52318-1. Nat Commun. 2024. PMID: 39261515 Free PMC article.
-
Enabling stem cell therapies through synthetic stem cell-niche engineering.J Clin Invest. 2010 Jan;120(1):60-70. doi: 10.1172/JCI41158. J Clin Invest. 2010. PMID: 20051637 Free PMC article. Review.
-
Developmental changes in hematopoietic stem cell properties.Exp Mol Med. 2013 Nov 15;45(11):e55. doi: 10.1038/emm.2013.98. Exp Mol Med. 2013. PMID: 24232254 Free PMC article. Review.
-
Thymic B cell development is controlled by the B potential of progenitors via both hematopoietic-intrinsic and thymic microenvironment-intrinsic regulatory mechanisms.PLoS One. 2018 Feb 20;13(2):e0193189. doi: 10.1371/journal.pone.0193189. eCollection 2018. PLoS One. 2018. PMID: 29462202 Free PMC article.
References
-
- Barnes DWH, Ford CE, Gray SM, Loutit JF. In: Progress in Nuclear Energy (Series VI) Bugher JC, Coursaget J, Loutit JF, editors. Oxford: Pergamon; 1959. pp. 1–10. - PubMed
-
- Keller G, Paige C, Gilboa E, Wagner EF. Nature. 1985;318:149–154. - PubMed
-
- Lemischka IR, Raulet DH, Mulligan RC. Cell. 1986;45:917–927. - PubMed
-
- Osawa M, Hanada KI, Hamada H, Nakauchi H. Science. 1996;273:242–245. - PubMed
-
- Uchida N, Dykstra B, Lyons KJ, Leung FYK, Eaves CJ. Exp Hematol. 2003;31:1338–1347. - PubMed
Publication types
MeSH terms
Grants and funding
LinkOut - more resources
Full Text Sources
Medical

