

Egr-1 binds the GnRH promoter to mediate the increase in gene expression by insulin
- PMID: 17379398
- PMCID: PMC1976257
- DOI: 10.1016/j.mce.2007.02.007
Egr-1 binds the GnRH promoter to mediate the increase in gene expression by insulin
Abstract
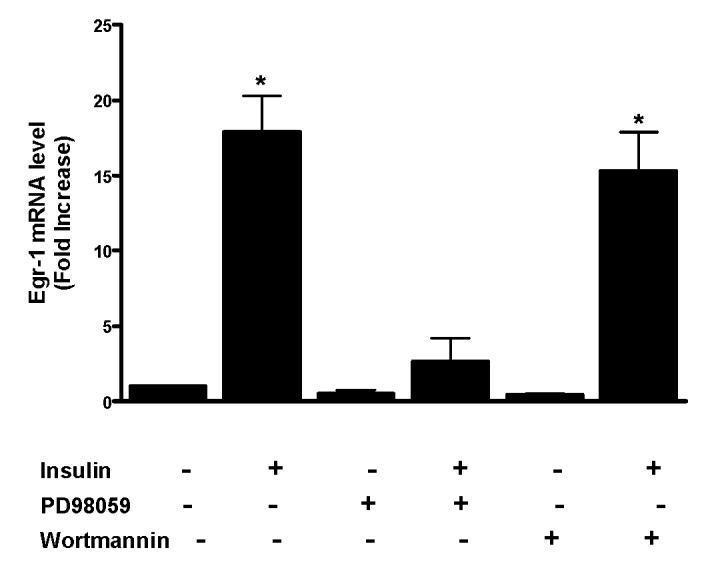
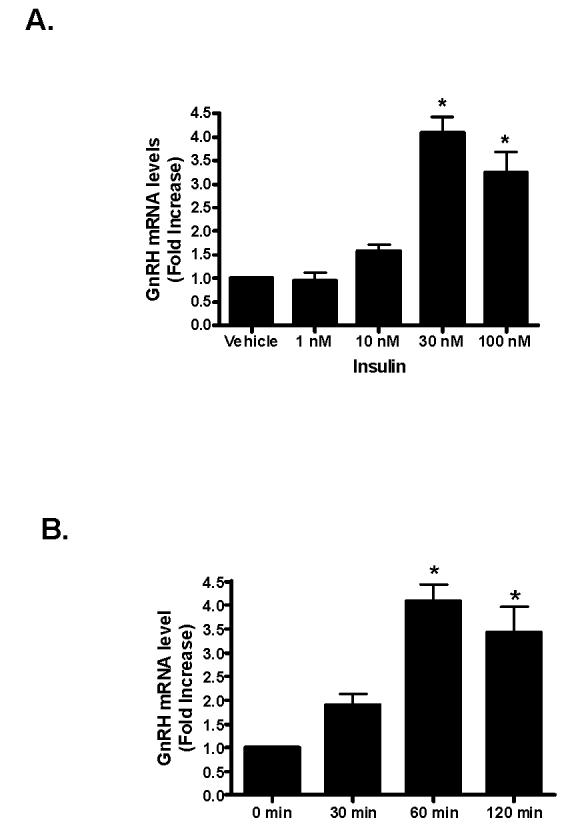
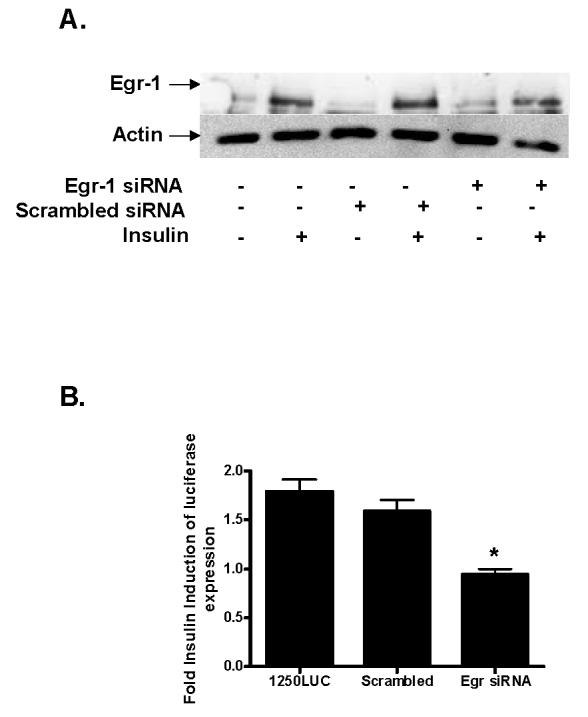
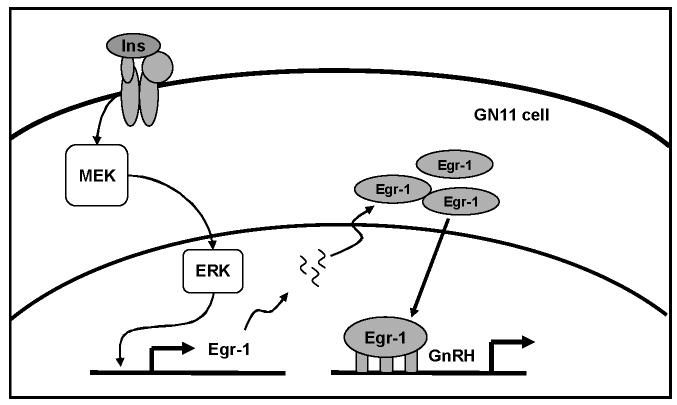
Insulin increases gonadotropin-releasing hormone (GnRH) gene expression in in vitro models of GnRH neurons. Early growth response-1 (Egr-1) is a transcription factor that mediates the effect of insulin on target genes. In the GN11 cell line--an immortalized GnRH-secreting neuronal cell line--insulin maximally increases Egr-1 mRNA after 30min of treatment and Egr-1 protein and GnRH mRNA after 60min of treatment. Egr-1 small interfering RNA blocks the insulin-induced increase in GnRH promoter activity, measured as luciferase expression. Chromatin immunoprecipitation using Egr-1 antibody precipitates DNA in a proximal region of the GnRH promoter but not DNA in a distal region. Mutagenesis of a putative Egr-1 binding site within the proximal region blocks the insulin-induced increase in GnRH promoter activity. Thus, Egr-1 binds the GnRH promoter at a site between -67 and -76bp from the transcriptional start site to mediate the insulin-induced increase in GnRH gene transcription.
Figures


Similar articles
-
Early growth response protein 1 binds to the luteinizing hormone-beta promoter and mediates gonadotropin-releasing hormone-stimulated gene expression.Mol Endocrinol. 1999 May;13(5):752-63. doi: 10.1210/mend.13.5.0276. Mol Endocrinol. 1999. PMID: 10319325
-
Induction of mPer1 expression by GnRH in pituitary gonadotrope cells involves EGR-1.Mol Cell Endocrinol. 2009 Nov 13;311(1-2):120-5. doi: 10.1016/j.mce.2009.07.005. Epub 2009 Jul 16. Mol Cell Endocrinol. 2009. PMID: 19616057
-
GnRH regulates early growth response protein 1 transcription through multiple promoter elements.Mol Endocrinol. 2002 Feb;16(2):221-33. doi: 10.1210/mend.16.2.0779. Mol Endocrinol. 2002. PMID: 11818496
-
The GnRH promoter: target of transcription factors, hormones, and signaling pathways.Mol Cell Endocrinol. 1998 May 25;140(1-2):151-5. doi: 10.1016/s0303-7207(98)00043-4. Mol Cell Endocrinol. 1998. PMID: 9722183 Review.
-
Early growth response-1 in the pathogenesis of cardiovascular disease.J Mol Med (Berl). 2016 Jul;94(7):747-53. doi: 10.1007/s00109-016-1428-x. Epub 2016 Jun 1. J Mol Med (Berl). 2016. PMID: 27251707 Review.
Cited by
-
Phorbol 12-myristate 13-acetate (PMA) responsive sequence in Galphaq promoter during megakaryocytic differentiation. Regulation by EGR-1 and MAP kinase pathway.Thromb Haemost. 2008 Nov;100(5):821-8. Thromb Haemost. 2008. PMID: 18989526 Free PMC article.
-
An Arf-Egr-C/EBPβ pathway linked to ras-induced senescence and cancer.Mol Cell Biol. 2015 Mar;35(5):866-83. doi: 10.1128/MCB.01489-14. Epub 2014 Dec 22. Mol Cell Biol. 2015. PMID: 25535333 Free PMC article.
-
Insulin receptor signaling in the GnRH neuron plays a role in the abnormal GnRH pulsatility of obese female mice.PLoS One. 2015 Mar 17;10(3):e0119995. doi: 10.1371/journal.pone.0119995. eCollection 2015. PLoS One. 2015. PMID: 25780937 Free PMC article.
-
Development of an immortalised, post-pubertal gonadotrophin-releasing hormone neuronal cell line.J Neuroendocrinol. 2008 Sep;20(9):1029-37. doi: 10.1111/j.1365-2826.2008.01760.x. Epub 2008 Jul 9. J Neuroendocrinol. 2008. PMID: 18624926 Free PMC article.
-
Targeted deletion of somatotroph insulin-like growth factor-I signaling in a cell-specific knockout mouse model.Mol Endocrinol. 2010 May;24(5):1077-89. doi: 10.1210/me.2009-0393. Epub 2010 Mar 8. Mol Endocrinol. 2010. PMID: 20211984 Free PMC article.
References
-
- Anderson RA, Zwain IH, Arroyo A, Mellon PL, Yen SS. The insulin-like growth factor system in the GT1-7 GnRH neuronal cell line. Neuroendocrinol. 1999;70:353–359. - PubMed
-
- Barroso I, Santisteban P. Insulin-induced early growth response gene (Egr-1) mediates a short term repression of rat malic enzyme gene transcription. J. Biol. Chem. 1999;274:17997–18004. - PubMed
-
- Bond CT, Hayflick JS, Seeburg PH, Adelman JP. The rat gonadotropin-releasing hormone: SH locus: Structure and hypothalamic expression. Mol. Endocrinol. 1989;5:243–255. - PubMed
-
- Bronson FH. Effect of food manipulation on the GnRH-LH-estradiol axis of young female rats. Am. J. Physiol. 1988;252:R140–R144. - PubMed
MeSH terms
Substances
Grants and funding
LinkOut - more resources
Full Text Sources
Medical
