Elevated expression levels of inhibitory receptor programmed death 1 on simian immunodeficiency virus-specific CD8 T cells during chronic infection but not after vaccination
- PMID: 17376899
- PMCID: PMC1900286
- DOI: 10.1128/JVI.00024-07
Elevated expression levels of inhibitory receptor programmed death 1 on simian immunodeficiency virus-specific CD8 T cells during chronic infection but not after vaccination
Abstract
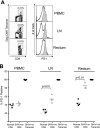
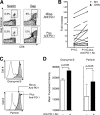
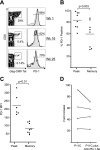
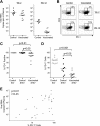
Here, we study the temporal expression of the inhibitory receptor programmed death 1 (PD-1) on simian immunodeficiency virus (SIV) Gag-specific T cells following pathogenic SIV infection or following vaccination with a DNA/modified vaccinia virus Ankara (DNA/MVA) vaccine and simian/human immunodeficiency virus (SHIV) challenge in macaques. Following infection, the majority (>95%) of Gag-specific CD8 T cells expressed PD-1, and the level of PD-1 expression per cell increased over time. The level of PD-1 expression in lymph nodes and rectal mucosal tissue, the major sites of virus replication, was higher compared to blood. In vitro blockade of PD-1 resulted in enhanced proliferation of SIV-specific CD8 as well as CD4 T cells. In contrast, following vaccination, the majority of peak effector Gag-specific CD8 T cells expressed low levels of PD-1, and these levels decreased further as the cells differentiated into memory cells. In addition, following SHIV challenge of these vaccinated macaques, the level of PD-1 expression on Gag-specific CD8 T cells correlated positively with plasma viremia. These results demonstrate that SIV-specific CD8 T cells express PD-1 after exposure to antigen but downregulate expression under conditions of antigen clearance and enhance expression under conditions of antigen persistence. They also demonstrate that the level of PD-1 expression per cell rather than the presence or absence of expression plays an important role in regulating CD8 T-cell dysfunction in pathogenic SIV infection. In addition, they demonstrate that similar to HIV infection, the PD-1:PD-1 ligand inhibitory pathway is operational in pathogenic SIV infection, and the macaque/SIV model would be ideal to test the safety and therapeutic benefit of blocking this pathway in vivo.
Figures


Similar articles
-
Vaccine-induced, simian immunodeficiency virus-specific CD8+ T cells reduce virus replication but do not protect from simian immunodeficiency virus disease progression.J Immunol. 2009 Jul 1;183(1):706-17. doi: 10.4049/jimmunol.0803746. J Immunol. 2009. PMID: 19542473
-
Containment of simian immunodeficiency virus infection in vaccinated macaques: correlation with the magnitude of virus-specific pre- and postchallenge CD4+ and CD8+ T cell responses.J Immunol. 2002 Nov 1;169(9):4778-87. doi: 10.4049/jimmunol.169.9.4778. J Immunol. 2002. PMID: 12391187
-
Vaccination of Macaques with DNA Followed by Adenoviral Vectors Encoding Simian Immunodeficiency Virus (SIV) Gag Alone Delays Infection by Repeated Mucosal Challenge with SIV.J Virol. 2019 Oct 15;93(21):e00606-19. doi: 10.1128/JVI.00606-19. Print 2019 Nov 1. J Virol. 2019. PMID: 31413132 Free PMC article.
-
Antiviral CD8+ T cells in the genital tract control viral replication and delay progression to AIDS after vaginal SIV challenge in rhesus macaques immunized with virulence attenuated SHIV 89.6.J Intern Med. 2009 Jan;265(1):67-77. doi: 10.1111/j.1365-2796.2008.02051.x. J Intern Med. 2009. PMID: 19093961 Free PMC article. Review.
-
Cytotoxic T lymphocytes specific for the simian immunodeficiency virus.Immunol Rev. 1999 Aug;170:127-34. doi: 10.1111/j.1600-065x.1999.tb01334.x. Immunol Rev. 1999. PMID: 10566147 Review.
Cited by
-
Tissue-specific differences in PD-1 and PD-L1 expression during chronic viral infection: implications for CD8 T-cell exhaustion.J Virol. 2010 Feb;84(4):2078-89. doi: 10.1128/JVI.01579-09. Epub 2009 Dec 2. J Virol. 2010. PMID: 19955307 Free PMC article.
-
High production rates sustain in vivo levels of PD-1high simian immunodeficiency virus-specific CD8 T cells in the face of rapid clearance.J Virol. 2013 Sep;87(17):9836-44. doi: 10.1128/JVI.01001-13. Epub 2013 Jul 3. J Virol. 2013. PMID: 23824823 Free PMC article.
-
Role of PD-1 co-inhibitory pathway in HIV infection and potential therapeutic options.Retrovirology. 2015 Feb 8;12:14. doi: 10.1186/s12977-015-0144-x. Retrovirology. 2015. PMID: 25756928 Free PMC article. Review.
-
Simian Immunodeficiency Virus-Producing Cells in Follicles Are Partially Suppressed by CD8+ Cells In Vivo.J Virol. 2016 Nov 28;90(24):11168-11180. doi: 10.1128/JVI.01332-16. Print 2016 Dec 15. J Virol. 2016. PMID: 27707919 Free PMC article.
-
Diagnostic Performance of PD-L1 versus PD-1 Expression in Circulating CD20 Cells in Diffuse Large B-Cell Lymphoma.Antibodies (Basel). 2022 Feb 16;11(1):15. doi: 10.3390/antib11010015. Antibodies (Basel). 2022. PMID: 35225873 Free PMC article.
References
-
- Akbar, A. N., N. J. Borthwick, R. G. Wickremasinghe, P. Panayoitidis, D. Pilling, M. Bofill, S. Krajewski, J. C. Reed, and M. Salmon. 1996. Interleukin-2 receptor common gamma-chain signaling cytokines regulate activated T cell apoptosis in response to growth factor withdrawal: selective induction of anti-apoptotic (bcl-2, bcl-xL) but not pro-apoptotic (bax, bcl-xS) gene expression. Eur. J. Immunol. 26:294-299. - PubMed
-
- Amara, R. R., K. Patel, G. Niedziela, P. Nigam, S. Sharma, S. I. Staprans, D. C. Montefiori, L. Chenareddi, J. G. Herndon, H. L. Robinson, H. M. McClure, and F. J. Novembre. 2005. A combination DNA and attenuated simian immunodeficiency virus vaccine strategy provides enhanced protection from simian/human immunodeficiency virus-induced disease. J. Virol. 79:15356-15367. - PMC - PubMed
-
- Amara, R. R., J. M. Smith, S. Staprans, D. Montefiori, F. Villinger, J. D. Altman, S. P. O'Neil, N. L. Kozyr, Y. Xu, L. Wyatt, P. L. Earl, J. G. Herndon, J. M. McNicholl, H. M. McClure, B. Moss, and H. L. Robinson. 2002. Critical role for Env as well as Gag-Pol for the control of a pathogenic SHIV challenge by a DNA/rMVA vaccine. J. Virol. 76:6138-6146. - PMC - PubMed
-
- Amara, R. R., F. Villinger, J. D. Altman, S. L. Lydy, S. P. O'Neil, S. Staprans, D. C. Montefiori, Y. Xu, J. G. Herndon, L. S. Wyatt, M. A. Candido, N. L. Kozyr, P. L. Earl, J. M. Smith, H.-L. Ma, B. D. Grimm, M. L. Hulsey, J. Miller, H. M. McClure, J. M. McNicholl, B. Moss, and H. L. Robinson. 2001. Control of a mucosal challenge and prevention of AIDS by a multiprotein DNA/MVA vaccine. Science 292:69-74. - PubMed
-
- Appay, V., D. F. Nixon, S. M. Donahoe, G. M. Gillespie, T. Dong, A. King, G. S. Ogg, H. M. Spiegel, C. Conlon, C. A. Spina, D. V. Havlir, D. D. Richman, A. Waters, P. Easterbrook, A. J. McMichael, and S. L. Rowland-Jones. 2000. HIV-specific CD8+ T cells produce antiviral cytokines but are impaired in cytolytic function. J. Exp. Med. 192:63-75. - PMC - PubMed
Publication types
MeSH terms
Substances
Grants and funding
LinkOut - more resources
Full Text Sources
Other Literature Sources
Research Materials

