Nutritional control of elongation of DNA replication by (p)ppGpp
- PMID: 17350574
- PMCID: PMC1850998
- DOI: 10.1016/j.cell.2006.12.043
Nutritional control of elongation of DNA replication by (p)ppGpp
Abstract
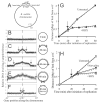
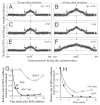
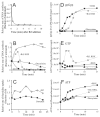
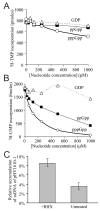
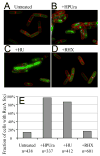
DNA replication is highly regulated in most organisms. Although much research has focused on mechanisms that regulate initiation of replication, mechanisms that regulate elongation of replication are less well understood. We characterized a mechanism that regulates replication elongation in the bacterium Bacillus subtilis. Replication elongation was inhibited within minutes after amino acid starvation, regardless of where the replication forks were located on the chromosome. We found that small nucleotides ppGpp and pppGpp, which are induced upon starvation, appeared to inhibit replication directly by inhibiting primase, an essential component of the replication machinery. The replication forks arrested with (p)ppGpp did not recruit the recombination protein RecA, indicating that the forks are not disrupted. (p)ppGpp appear to be part of a surveillance mechanism that links nutrient availability to replication by rapidly inhibiting replication in starved cells, thereby preventing replication-fork disruption. This control may be important for cells to maintain genomic integrity.
Figures
Comment in
-
Magic spots cast a spell on DNA primase.Cell. 2007 Mar 9;128(5):823-4. doi: 10.1016/j.cell.2007.02.020. Cell. 2007. PMID: 17350566
Similar articles
-
Magic spots cast a spell on DNA primase.Cell. 2007 Mar 9;128(5):823-4. doi: 10.1016/j.cell.2007.02.020. Cell. 2007. PMID: 17350566
-
Dose-dependent reduction of replication elongation rate by (p)ppGpp in Escherichia coli and Bacillus subtilis.Mol Microbiol. 2013 Apr;88(1):93-104. doi: 10.1111/mmi.12172. Epub 2013 Mar 6. Mol Microbiol. 2013. PMID: 23461544 Free PMC article.
-
The Alarmone (p)ppGpp Regulates Primer Extension by Bacterial Primase.J Mol Biol. 2021 Sep 17;433(19):167189. doi: 10.1016/j.jmb.2021.167189. Epub 2021 Aug 10. J Mol Biol. 2021. PMID: 34389317 Free PMC article.
-
Control of bacterial transcription, translation and replication by (p)ppGpp.Curr Opin Microbiol. 2008 Apr;11(2):100-5. doi: 10.1016/j.mib.2008.02.001. Epub 2008 Mar 24. Curr Opin Microbiol. 2008. PMID: 18359660 Review.
-
Intersection of the stringent response and the CodY regulon in low GC Gram-positive bacteria.Int J Med Microbiol. 2014 Mar;304(2):150-5. doi: 10.1016/j.ijmm.2013.11.013. Epub 2013 Dec 1. Int J Med Microbiol. 2014. PMID: 24462007 Review.
Cited by
-
Different effects of ppGpp on Escherichia coli DNA replication in vivo and in vitro.FEBS Open Bio. 2013 Mar 6;3:161-4. doi: 10.1016/j.fob.2013.03.001. Print 2013. FEBS Open Bio. 2013. PMID: 23772389 Free PMC article.
-
Binding mechanism of metal⋅NTP substrates and stringent-response alarmones to bacterial DnaG-type primases.Structure. 2012 Sep 5;20(9):1478-89. doi: 10.1016/j.str.2012.05.017. Epub 2012 Jul 12. Structure. 2012. PMID: 22795082 Free PMC article.
-
The transcription factor DksA prevents conflicts between DNA replication and transcription machinery.Cell. 2010 May 14;141(4):595-605. doi: 10.1016/j.cell.2010.03.036. Cell. 2010. PMID: 20478253 Free PMC article.
-
Crosstalk between guanosine nucleotides regulates cellular heterogeneity in protein synthesis during nutrient limitation.PLoS Genet. 2022 May 20;18(5):e1009957. doi: 10.1371/journal.pgen.1009957. eCollection 2022 May. PLoS Genet. 2022. PMID: 35594298 Free PMC article.
-
The stringent response and cell cycle arrest in Escherichia coli.PLoS Genet. 2008 Dec;4(12):e1000300. doi: 10.1371/journal.pgen.1000300. Epub 2008 Dec 12. PLoS Genet. 2008. PMID: 19079575 Free PMC article.
References
-
- Autret S, Levine A, Vannier F, Fujita Y, Seror SJ. The replication checkpoint control in Bacillus subtilis: identification of a novel RTP-binding sequence essential for the replication fork arrest after induction of the stringent response. Mol Microbiol. 1999;31:1665–1679. - PubMed
-
- Baker TA, Bell SP. Polymerases and the replisome: machines within machines. Cell. 1998;92:295–305. - PubMed
-
- Barnes MH, Brown NC. Purification of DNA polymerase III of gram-positive bacteria. Methods Enzymol. 1995;262:35–42. - PubMed
-
- Belitskii BR, Shakulov RS. [Guanosine polyphosphate concentration and stable RNA synthesis in Bacillus subtilis following suppression of protein synthesis] Mol Biol (Mosk) 1980;14:1342–1353. - PubMed
Publication types
MeSH terms
Substances
Grants and funding
LinkOut - more resources
Full Text Sources
Other Literature Sources

