A unified mechanism for protein folding: predetermined pathways with optional errors
- PMID: 17322530
- PMCID: PMC2203325
- DOI: 10.1110/ps.062655907
A unified mechanism for protein folding: predetermined pathways with optional errors
Abstract
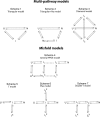
There is a fundamental conflict between two different views of how proteins fold. Kinetic experiments and theoretical calculations are often interpreted in terms of different population fractions folding through different intermediates in independent unrelated pathways (IUP model). However, detailed structural information indicates that all of the protein population folds through a sequence of intermediates predetermined by the foldon substructure of the target protein and a sequential stabilization principle. These contrary views can be resolved by a predetermined pathway--optional error (PPOE) hypothesis. The hypothesis is that any pathway intermediate can incorporate a chance misfolding error that blocks folding and must be reversed for productive folding to continue. Different fractions of the protein population will then block at different steps, populate different intermediates, and fold at different rates, giving the appearance of multiple unrelated pathways. A test of the hypothesis matches the two models against extensive kinetic folding results for hen lysozyme which have been widely cited in support of independent parallel pathways. The PPOE model succeeds with fewer fitting constants. The fitted PPOE reaction scheme leads to known folding behavior, whereas the IUP properties are contradicted by experiment. The appearance of a conflict with multipath theoretical models seems to be due to their different focus, namely on multitrack microscopic behavior versus cooperative macroscopic behavior. The integration of three well-documented principles in the PPOE model (cooperative foldons, sequential stabilization, optional errors) provides a unifying explanation for how proteins fold and why they fold in that way.
Figures


Similar articles
-
Depressing time: Waiting, melancholia, and the psychoanalytic practice of care.In: Kirtsoglou E, Simpson B, editors. The Time of Anthropology: Studies of Contemporary Chronopolitics. Abingdon: Routledge; 2020. Chapter 5. In: Kirtsoglou E, Simpson B, editors. The Time of Anthropology: Studies of Contemporary Chronopolitics. Abingdon: Routledge; 2020. Chapter 5. PMID: 36137063 Free Books & Documents. Review.
-
Unlocking data: Decision-maker perspectives on cross-sectoral data sharing and linkage as part of a whole-systems approach to public health policy and practice.Public Health Res (Southampt). 2024 Nov 20:1-30. doi: 10.3310/KYTW2173. Online ahead of print. Public Health Res (Southampt). 2024. PMID: 39582242
-
Using Experience Sampling Methodology to Capture Disclosure Opportunities for Autistic Adults.Autism Adulthood. 2023 Dec 1;5(4):389-400. doi: 10.1089/aut.2022.0090. Epub 2023 Dec 12. Autism Adulthood. 2023. PMID: 38116059 Free PMC article.
-
"I've Spent My Whole Life Striving to Be Normal": Internalized Stigma and Perceived Impact of Diagnosis in Autistic Adults.Autism Adulthood. 2023 Dec 1;5(4):423-436. doi: 10.1089/aut.2022.0066. Epub 2023 Dec 12. Autism Adulthood. 2023. PMID: 38116050 Free PMC article.
-
Trends in Surgical and Nonsurgical Aesthetic Procedures: A 14-Year Analysis of the International Society of Aesthetic Plastic Surgery-ISAPS.Aesthetic Plast Surg. 2024 Oct;48(20):4217-4227. doi: 10.1007/s00266-024-04260-2. Epub 2024 Aug 5. Aesthetic Plast Surg. 2024. PMID: 39103642 Review.
Cited by
-
Visualizing transient protein-folding intermediates by tryptophan-scanning mutagenesis.Nat Struct Mol Biol. 2012 Jun 10;19(7):731-6. doi: 10.1038/nsmb.2322. Nat Struct Mol Biol. 2012. PMID: 22683996
-
Branching in the sequential folding pathway of cytochrome c.Protein Sci. 2007 Sep;16(9):1946-56. doi: 10.1110/ps.072922307. Epub 2007 Jul 27. Protein Sci. 2007. PMID: 17660254 Free PMC article.
-
The nature of protein folding pathways.Proc Natl Acad Sci U S A. 2014 Nov 11;111(45):15873-80. doi: 10.1073/pnas.1411798111. Epub 2014 Oct 17. Proc Natl Acad Sci U S A. 2014. PMID: 25326421 Free PMC article. Review.
-
Life in Phases: Intra- and Inter- Molecular Phase Transitions in Protein Solutions.Biomolecules. 2019 Dec 8;9(12):842. doi: 10.3390/biom9120842. Biomolecules. 2019. PMID: 31817975 Free PMC article. Review.
-
Protein folding and misfolding: mechanism and principles.Q Rev Biophys. 2007 Nov;40(4):287-326. doi: 10.1017/S0033583508004654. Epub 2008 Apr 14. Q Rev Biophys. 2007. PMID: 18405419 Free PMC article. Review.
References
-
- Anderson E., Bai, Z., Bischof, C., Blackford, S., Demmel, J., Dongarra, J., Du Croz, J., Greenbaum, A., Hammarling, S., and McKenney, A., et al. 1999. LAPACK users’ guide. Society for Industrial and Applied Mathematics, Philadelphia.
-
- Baldwin R.L.. 1995. The nature of protein folding pathways: The classical versus the new view. J. Biomol. NMR 5: 103–109. - PubMed
-
- Barshop B.A., Wrenn, R.F., and Frieden, C. 1983. Analysis of numerical methods for computer simulation of kinetic processes: Development of KINSIM—A flexible, portable system. Anal. Biochem. 130: 134–145. - PubMed
Publication types
MeSH terms
Substances
Grants and funding
LinkOut - more resources
Full Text Sources
Other Literature Sources

