. 2007 Mar;170(3):875-87.
doi: 10.2353/ajpath.2007.060816.

Murine FLIP transgene expressed on thyroid epithelial cells promotes resolution of granulomatous experimental autoimmune thyroiditis in DBA/1 mice

Affiliations

Murine FLIP transgene expressed on thyroid epithelial cells promotes resolution of granulomatous experimental autoimmune thyroiditis in DBA/1 mice

Yujiang Fang et al. Am J Pathol. 2007 Mar.

Abstract

Granulomatous experimental autoimmune thyroiditis (G-EAT) is induced by mouse thyroglobulin-sensitized splenocytes activated in vitro with mouse thyroglobulin and interleukin-12. In wild-type (WT) DBA/1 recipients of WT donor splenocytes, thyroid lesions reach maximal severity at day 20, with ongoing inflammation and extensive fibrosis at day 60. Our previous studies indicated the site of expression of FLIP and Fas ligand [thyroid epithelial cells (TECs) versus inflammatory cells] differed in mice when lesions would resolve or progress to fibrosis. To test the hypothesis that expression of FLIP by TECs would promote earlier G-EAT resolution in DBA/1 mice, transgenic (Tg) DBA/1 mice expressing FLIP on TECs were generated. In FLIP Tg(+) and Tg(-) littermate recipients of WT donor splenocytes, G-EAT severity was comparable at day 20, but fibrosis was decreased, and many lesions resolved by day 60 in Tg(+) but not Tg(-) recipients. FLIP and Fas ligand were primarily expressed by TECs in Tg(+) recipients and by inflammatory cells in Tg(-) recipients at day 60. Apoptosis of inflammatory cells was greater, and expression of proinflammatory cytokines was decreased in thyroids of Tg(+) compared with Tg(-) recipients. These results are consistent with the hypothesis that transgenic expression of FLIP on thyroid epithelial cells promotes earlier resolution of granulomatous experimental autoimmune thyroiditis.


Figures
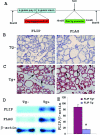
Figure 1
Figure 1
Generation of cFLIPL transgenic mice and expression of FLIP transgene. A: Map of the cFLIP transgene. FLAG-tagged mouse cFLIPL (1.5 kb) was cloned into a targeting vector (pBSKII), driven by the 900-bp RTg promoter. The 3.5-kb fragment was microinjected into fertilized oocytes of FVB female mice. B and C: IHC of FLIP (left) and FLAG (right) in thyroids of normal DBA/1 FLIP Tg and Tg+ littermates. Both FLIP and FLAG were highly expressed in thyroids of naïve Tg+ mice (arrows) but were not detected in thyroids of naïve Tg mice (magnification, ×400). D: Protein expression of FLIP and FLAG in thyroids of FLIP Tg+ and Tg littermates. Thirty micrograms of protein was loaded in each lane. Results are representative of three experiments. E: Dot blot analysis of tail DNA from naïve FLIP Tg+ and Tg littermates. Twenty micrograms of DNA was loaded, and 1.5-kb murine FLIP Klenow was used as probe template. β-Actin was used for data normalization. FLIP transgene level in Tg+ littermates was nearly six times higher than in Tg littermates. Bars are means of data for thyroids of Tg littermates (four to six individuals) and Tg+ littermates (16 individuals) ± SEM. Results are expressed as the mean ratio of densitometric U/β-actin ± SEM (×100) and are representative of three independent experiments. A significant difference is indicated by the asterisk.
Figure 2
Figure 2
Adoptive transfer of MTg-activated WT DBA/1 spleen cells into FLIP Tg+ and FLIP Tg littermate recipients. G-EAT severity scores of individual mice 20 and 60 days after cell transfer are shown. The severity of thyroid lesions in Tg+ recipients at day 60 was significantly decreased (average severity score, 3.3) compared with those in Tg littermates (average severity score, 4.5), P < 0.001 at day 60 using both two-tailed Student’s t-test and the Mann-Whitney rank sum test. A significant difference is indicated by the asterisk. Results are pooled from three separate representative experiments.
Figure 3
Figure 3
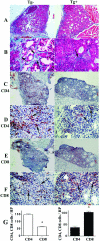
Collagen deposition (fibrosis) and CD4+ and CD8+ T cells in thyroids of FLIP Tg+ and Tg littermate recipients with G-EAT. A and B: Masson’s Trichrome staining for collagen (blue) in thyroids of FLIP Tg+ (right) and Tg recipients (left) at day 60. There was minimal deposition of collagen (blue, arrows) in thyroids of FLIP Tg+ recipients compared with Tg littermates. C and D: CD4+ T cells (red, arrows) in thyroids of FLIP Tg+ (right) and Tg recipients (left) at day 60. E and F: CD8+ T cells (red, arrows) in thyroids of FLIP Tg+ (right) and Tg recipients (left) at day 60. Results are representative areas on slides from at least three individual mice examined in each group. G: CD4+ and CD8+ T cells in five to six randomly selected high-power fields of three individual mice/group (magnification, ×400) were manually counted. CD4+ T cells outnumbered CD8+ T cells in FLIP Tg recipients with ongoing inflammation (4 to 5+ severity scores) and fibrosis at day 60 (G, left), whereas CD8+ T cells outnumbered CD4+ T cells in FLIP Tg+ recipients when lesions were beginning to resolve (4+ severity scores) (G, right). A significant difference is indicated by the asterisk. Magnification, ×100 (in A, C, and E); ×400 (B, D, and F).
Figure 4
Figure 4
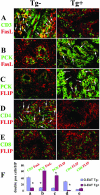
FLIP and FasL distribution in thyroids of FLIP Tg+ and Tg recipients at day 60. A–C: CD4+ and CD8+ T cells were identified by CD3 (A, green) and TECs by PCK (B and C, green) on paraffin sections of thyroids. Although TECs and inflammatory cells both expressed FasL (A and B, red) in FLIP Tg (left) and Tg+ recipients (right), FasL was mainly expressed by CD3+ inflammatory cells in FLIP Tg recipients (A, left, yellow, overlay, arrows) and by PCK + TECs in FLIP Tg+ recipients (B, right, yellow, overlay, arrows). TECs and inflammatory cells both expressed FLIP (C, red) in FLIP Tg (left) and Tg+ recipients (right); FLIP was mainly expressed by PKC + TECs in FLIP Tg+ recipients (C, right, yellow, overlay, arrows). D and E: Confocal staining of CD4 (D, green) or CD8 (E, green) on frozen sections with FLIP (D and E, red) showed that FLIP was mainly expressed by CD4+ T cells in FLIP Tg recipients (D, left, yellow, overlay, arrows), whereas very few CD4+ T cells in Tg+ recipients expressed FLIP (D, right, yellow, overlay). F: Double positive cells (yellow, overlay, in A–E) in four to five randomly selected high-power fields of three individual mice/group (magnification, ×600) were manually counted and summarized in F (bars a–e correspond to panels AE). A significant difference between G-EAT FLIP Tg recipients and Tg+ recipients is indicated by the asterisk (P < 0.05). Magnification: A, ×800, BE, ×600. Results are representative areas on slides from at least three individual mice examined per group. Mice in both groups had comparable G-EAT severity scores (4 to 5+).
Figure 5
Figure 5
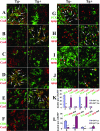
Evaluation of active caspase-8, active capase-3, and apoptosis in thyroids of FLIP Tg+ and Tg recipients at day 20. A–F: Confocal staining of TECs, CD4, or CD8 on frozen sections with active caspase-8 or active caspase-3. CD4+ and CD8+ T cells (B, C, E, and F, green) and PCK + TECs (A and D, green) both expressed active caspase-8 (A–C, red) in FLIP Tg (left) and Tg+ recipients (right), and active caspase-8 was mainly expressed by TECs in FLIP Tg recipients (A, left, yellow, overlay, arrows) and by CD4+ T cells in FLIP Tg+ recipients (B, right, yellow, overlay, arrows). Active caspase-3 was primarily expressed by TECs in FLIP Tg recipients (D, left, yellow, overlay, arrows) and by CD4+ T cells in FLIP Tg+ recipients at day 20 (E, right, yellow, overlay, arrows). G–J: Confocal staining of TECs and CD3+ T cells (green) on paraffin sections with apoptosis (red nuclear staining). There were many apoptotic cells in thyroids of both FLIP Tg+ and Tg littermates with 4 to 5+ G-EAT severity scores at day 20 (red, G and H) and many fewer apoptotic cells in thyroids of both groups at day 60 (red, I and J). Apoptosis (red) was mainly in TECs in FLIP Tg recipients both at days 20 (G, left, arrows) and 60 (I, left, arrows) and mainly in inflammatory cells in FLIP Tg+ recipients both at days 20 (H, right, arrows) and 60 (J, right, arrows). K and L: Double positive cells (yellow, overlay, in A–F; or red circled by green in G–J) in four to five randomly selected high-power fields of three individual mice/group (magnification, ×800) were manually counted and summarized in K and L (bars a–j correspond to panels A–J). A significant difference between G-EAT FLIP Tg recipients and Tg+ recipients is indicated by the asterisk (P < 0.05). Magnification, ×800 (A–J). Shown are representative areas on slides of thyroids of at least three individual mice per group.
Figure 6
Figure 6
FLIP protein and mRNA expression in thyroids of FLIP Tg+ and Tg recipients at day 20. A: FLIP mRNA was undetectable in thyroids of normal unimmunized Tg mice but was significantly up-regulated (P < 0.05) in thyroids of FLIP Tg recipients with severe (4 to 5+) G-EAT at day 20. FLIP mRNA expression in thyroids of normal FLIP Tg+ mice was similar to that in thyroids of FLIP Tg recipients with severe G-EAT and was further up-regulated (P < 0.05) in thyroids of FLIP Tg+ recipients with 4 to 5+ G-EAT at day 20. Results are expressed as the mean ratio of FLIP densitometric U/hypoxanthine phosphoribosyltransferase ± SEM (×100) of five to six individual mice per group and are representative of three independent experiments. B: FLIP protein was significantly higher (P < 0.05) in thyroids of FLIP Tg+ recipients compared with Tg recipients with 4 to 5+ G-EAT at day 20. Thirty micrograms of protein from thyroids of the FLIP Tg+ (four individuals) and Tg recipients (four individuals) was loaded in each lane, and results for FLIP and β-actin are shown at the top in B. Results are expressed as the mean ratio of densitometric U/β-actin ± SEM (×100) and are representative of three independent experiments. A significant difference between G-EAT FLIP Tg recipients and Tg+ recipients is indicated by the asterisk (P < 0.05).
Figure 7
Figure 7
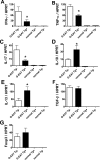
Cytokine and Foxp3 mRNA expression in thyroids of FLIP Tg+ and Tg recipients. A–G: mRNA was isolated from a single thyroid lobe of individual mice 40 days after cell transfer and amplified as described in Materials and Methods. All thyroids had comparable 4 to 5+ severity scores. IFN-γ, TNF-α, IL-17, IL-10, IL-13, TGF-β, and Foxp3 mRNA (A–G) was undetectable in thyroids of normal Tg+ or Tg mice. At day 40, IFN-γ, TNF-α, and IL-17 mRNA expression (A–C) was lower, IL-10 and IL-13 mRNA expression (D and E) was higher, TGF-β and Foxp3 mRNA expression (F and G) was similar in thyroids of FLIP Tg+ compared with Tg littermate recipients. Results are expressed as the mean ratio of cytokine densitometric U/hypoxanthine phosphoribosyltransferase ± SEM (×100) of five to six mice per group and are representative of three independent experiments. A significant difference between G-EAT FLIP Tg recipients and Tg+ recipients is indicated by the asterisk (P < 0.05).

Similar articles

Cited by

References

    1. Lira SA, Martin AP, Marinkovic T, Furtado GC. Mechanisms regulating lymphocytic infiltration of the thyroid in murine models of thyroiditis. Crit Rev Immunol. 2005;25:251–262. - PubMed
    1. Braley-Mullen H, Johnson M, Sharp GC, Kyriakos M. Induction of experimental autoimmune thyroiditis in mice with in vitro activated splenic T cells. Cell Immunol. 1985;93:132–143. - PubMed
    1. Conaway DH, Giraldo AA, David CS, Kong YC. In situ analysis of T cell subset composition in experimental autoimmune thyroiditis after adoptive transfer of activated spleen cells. Cell Immunol. 1990;125:247–253. - PubMed
    1. Braley-Mullen H, Sharp GC, Bickel JT, Kyriakos M. Induction of severe granulomatous experimental autoimmune thyroiditis in mice by effector cells activated in the presence of anti-interleukin 2 receptor antibody. J Exp Med. 1991;173:899–912. - PMC - PubMed
    1. Braley-Mullen H, Sharp GC, Tang H, Chen K, Kyriakos M, Bickel JT. Interleukin-12 promotes activation of effector cells that induce a severe destructive granulomatous form of murine experimental autoimmune thyroiditis. Am J Pathol. 1998;152:1347–1358. - PMC - PubMed

Publication types

MeSH terms