. 2007 Jun 20;363(1):113-23.
doi: 10.1016/j.virol.2006.12.025. Epub 2007 Feb 21.

Mapping and restriction of a dominant viral CD4+ T cell core epitope by both MHC class I and MHC class II

Affiliations

Mapping and restriction of a dominant viral CD4+ T cell core epitope by both MHC class I and MHC class II

Dirk Homann et al. Virology. .

Abstract

Virus-specific CD4(+) T cells contribute to effective virus control through a multiplicity of mechanisms including direct effector functions as well as "help" for B cell and CD8(+) T cell responses. Here, we have used the lymphocytic choriomeningitis virus (LCMV) system to assess the minimal constraints of a dominant antiviral CD4(+) T cell response. We report that the core epitope derived from the LCMV glycoprotein (GP) is 11 amino acids in length and provides optimal recognition by epitope-specific CD4(+) T cells. Surprisingly, this epitope is also recognized by LCMV-specific CD8(+) T cells and thus constitutes a unique viral determinant with dual MHC class I- and II-restriction.


Figures

Fig. 1
Fig. 1. Establishment and functional characterization of GP61–80-specific CD4+ T cell lines and clones
CD4+ T cell lines and clones were generated as detailed in Materials and methods. To evaluate antigen-specific T cell function and TCR usage, cells were rested by antigen withdrawal, supplemented with congenic (Thy1.1+) spleen cells to provide a source for MHC class II-restricted antigen presentation and stimulated for 5 h with GP61–80 peptide. Cells were subsequently stained for CD4, Thy1.1 and TCR Vβ8.1/8.2 as well as intracellular IFNγ. Dot plots on the right are gated on Thy1.1-negative CD4+ T cells as indicated by the exemplary dot plot on the left; boxed values indicate percentages of IFNγ+ gated CD4+ T cells.
Fig. 2
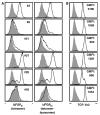
Fig. 2. T cell receptor usage by GP61–80-specific CD4+ T cell clones/lines
(A) CD4+ T cell clones/lines were rested in the absence of antigen and stained for CD4 as well as tetramers (left column) or tetramer-liposomes (right column) as detailed in Materials and methods. Black tracings indicate staining with I-AbGP61–80 tetramers or tetramer-liposomes; gray histograms indicate control stains with I-AbOVA323–339 tetramers or tetramer-liposomes. (B) In parallel stains, TCR expression levels were determined by staining for TCR Vα2 (black tracing); for control stains (gray histograms) cells were stained for TCR Vα8. Values represent the geometric mean of fluorescence intensity (GMFI) of Vα2 stains.
Fig. 3
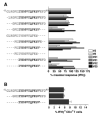
Fig. 3. Identification of the minimal GP61–80 binding constraints
(A) CD4+ T cell clones and lines #3, #8, #21, #31, #32 and #35 were rested by antigen withdrawal, restimulated with indicated peptides and stained for intracellular IFN. The percentage of IFNγ+ cells after stimulation with the native GP61–80 peptide of individual cell lines or clones was set at 100% and the values after stimulation with truncated peptides were calculated accordingly. All clones/cell lines (#3, #8, #21, #31, #32 and #35) were tested in parallel. Data for individual clones/cell lines obtained in two separate experiments were combined according to peptide sequences used for stimulation; no statistical analysis was performed as each value consists of only 2 data points. (B) Eight days after LCMV infection of B6 mice, spleen cells were restimulated with indicated peptides and frequencies of epitope-specific CD4+ T cells were determined by intracellular IFNγ staining (3 mice/experiment; values indicate SEM of one out of four independent experiments).
Fig. 4
Fig. 4. Recognition of the GP67–77 core epitope by both virus-specific CD4+ and CD8+ T cells
Spleen cells harvested from B6 mice infected with 1.5×10⁵ pfu LCMV Armstrong i.p. 8 days earlier were stimulated for 5 h with the indicated peptides (nil: no peptide) and analyzed for induced IFNγ expression (Plots are gated on spleen cells according to FSC/SSC properties. Values indicate percentages of IFNγ+ cells in indicated rectangular gates; absence of values in some gates refers to background staining levels of <0.1%). (A) Analysis of specific CD4+ T cell responses demonstrates IFNγ induction in CD4-negative cells only after stimulation with GP67 (red gate) but not GP61 or NP309 peptides. (B) Parallel analyses of IFNγ production by CD8+ T cells revealed induction of IFNγ in CD8-negative cells only after stimulation with GP67 peptide (red gate). (C) Left panel: Seven days after LCMV infection of B6 (Db+/+/Kb+/+), B6.Db−/−/Kb+/+ and B6.Db−/−/Kb−/− mice, spleen cell suspensions were tested for specific epitope-specific CTL activity using virus-infected or peptide-coated target cells in a conventional 5 h ex vivo CTL assay. Specific lysis for effector:target cell cultures at a ratio of 50:1 is shown; values indicate the percentage (SEM) of 51Cr release from target cells. Note that lack of Db expression abolishes killing of GP65–77 and GP67–77 coated target cells. Right panel: Eight days after infection of B6.Db−/−/Kb+/+ and B6.Db+/+/Kb−/− mice, epitope-specific CD8+T cell responses were quantified by peptide restimulation and intracellular IFNg staining; displayed are the percentages of epitope-specific CD8+T cells (3 mice/group, SEM). Note that lack of Db expression abolishes GP67–77-induced IFNg production. The NP396–404-specific IFNg response has been included as a control for a bona fide Db-restricted CD8+T cell response. (D) Phenotype of GP67–77-specific T cells. Eight days after LCMV infection of B6 mice, spleen cells were restimulated with GP67–77 peptide and stained for CD8α, CD4 and intracellular IFNγ. The dot plot is gated on IFNγ+T cells indicating the distribution of GP67–77-specific T cells among CD8+ and CD4+ subsets. The adjacent bar diagram summarizes these findings (3 mice/experiment; 3 independent experiments).
Fig. 5
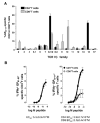
Fig. 5. TCRVβ usage and functional avidities of GP67–77-specific CD4+ and CD8+ effector Tcells
(A) Effector spleen cells (8 days after LCMV) were restimulated for 5 h with GP67–77 peptide and stained for surface markers (CD8, CD4, TCRVβ subfamily) and intracellular IFNγ. Bar diagrams display relative distribution of TCRVβ usage by GP67–77-specific (IFNγ+) CD4+ (black) and CD8+ (gray) Tcells. The dotted line indicates the level of non-specific background staining. Bars indicate mean± SE from 2 independent experiments using 2–3 mice each. (B) Functional avidities were determined by culture of effector spleen cell suspension with graded dosages of GP61–80 or GP67–77 peptide and plotting of IFNγ+ effector T cell frequencies (mean±SE) against the peptide concentration used for restimulation (data from 1 of 3 independent experiments using 2–3 mice each). Values listed below the graphs represent the EC50 for indicated peptide specificities and specific Tcells, i.e. the peptide concentration required to elicit detectable IFNγ induction in half of the GP61–80- (left) and GP67–77- specific (right) CD4+ or CD8+ Tcell populations (mean±SE, 1 of 3 independent experiments). Although EC50 values of GP67–77- specific CD4+ and CD8+ T cells as well as of GP61–80- and GP67–77-specific CD4+ T cells were not significantly different, GP67–77-specific CD8+ T cells exhibited a lower EC50 when compared to GP61–80-specific CD4+ T cells (p=0.0085).
Fig. 6
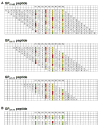
Fig. 6. Fitting of dominant LCMV-GP epitope sequences to I-Ab
P1 to P9 signify I-Ab binding pockets. The interactions of individual amino acids with I-Ab binding pockets are differentiated according to optimal (green), neutral (yellow) and unfavorable (red) binding properties. (A) Potential alignments and registers for GP61–80, GP64–77 and GP67–77. The shortening of the original peptide was done first using each alignment. (B) Then, the minimal peptide, GP67–77, was modified in 2 registers to try to increase affinity and T cell response by introducing optimal anchor residues.
Fig. 7
Fig. 7. Determining the affinity of TCR #3
Recombinant T cell receptors based on sequences derived from clone #3 were constructed as detailed in Materials and methods and tested for binding to I-AbGP61–80 complexes by plasmon surface resonance. TCR3: recombinant GP61–80-specific TCR obtained from clone #3; Ctl: control.

Similar articles

Cited by

References

    1. Anderson J, Byrne JA, Schreiber R, Patterson S, Oldstone MB. Biology of cloned cytotoxic T lymphocytes specific for lymphocytic choriomeningitis virus: clearance of virus and in vitro properties. J Virol. 1985;53(2):552–560. - PMC - PubMed
    1. Apostolopoulos V, Yu M, Corper AL, Li W, McKenzie IF, Teyton L, Wilson IA, Plebanski M. Crystal structure of a non-canonical high affinity peptide complexed with MHC class I: a novel use of alternative anchors. J Mol Biol. 2002;318(5):1307–1316. - PubMed
    1. Appay V. The physiological role of cytotoxic CD4 (+) T-cells: the holy grail? Clin Exp Immunol. 2004;138(1):10–13. - PMC - PubMed
    1. Belkaid Y, Rouse BT. Natural regulatory T cells in infectious disease. Nat Immunol. 2005;6(4):353–360. - PubMed
    1. Berger DP, Homann D, Oldstone MB. Defining parameters for successful immunocytotherapy of persistent viral infection. Virology. 2000;266(2):257–263. - PubMed

Publication types

MeSH terms

Substances