. 2007 Feb;26(2):257-70.
doi: 10.1016/j.immuni.2007.01.007.

Initial events in establishing vaginal entry and infection by human immunodeficiency virus type-1

Affiliations

Initial events in establishing vaginal entry and infection by human immunodeficiency virus type-1

Florian Hladik et al. Immunity. 2007 Feb.

Abstract

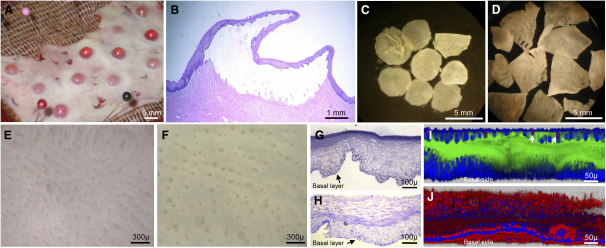
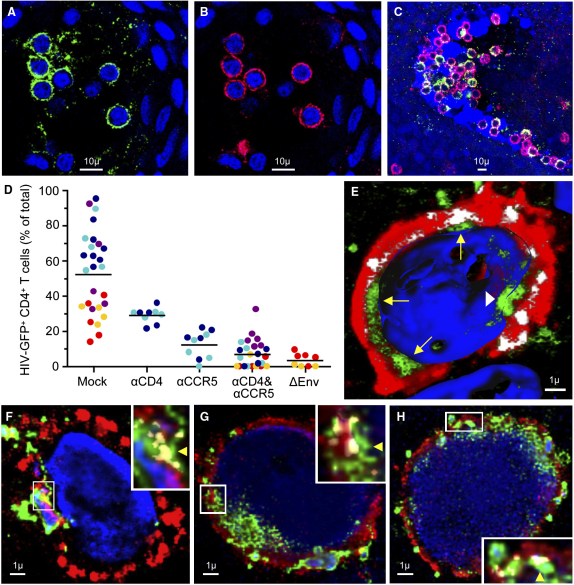
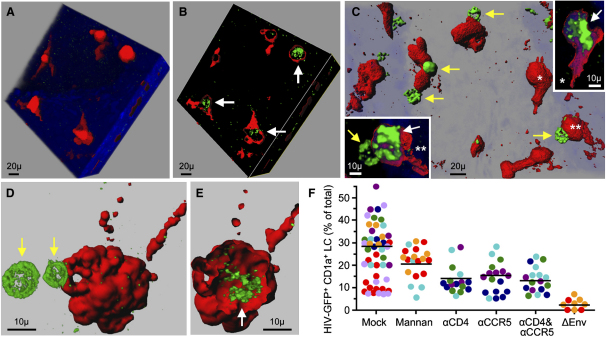
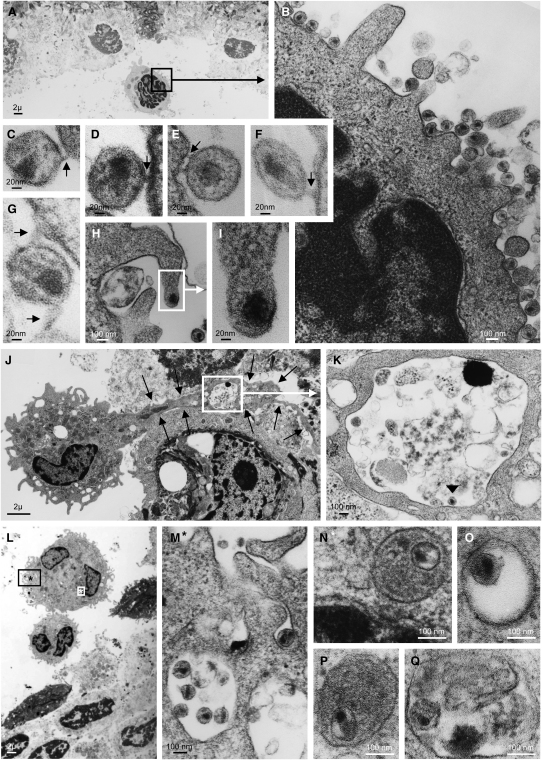
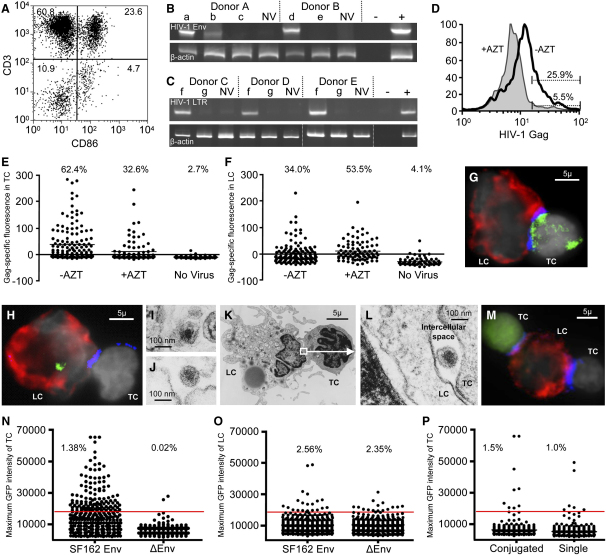
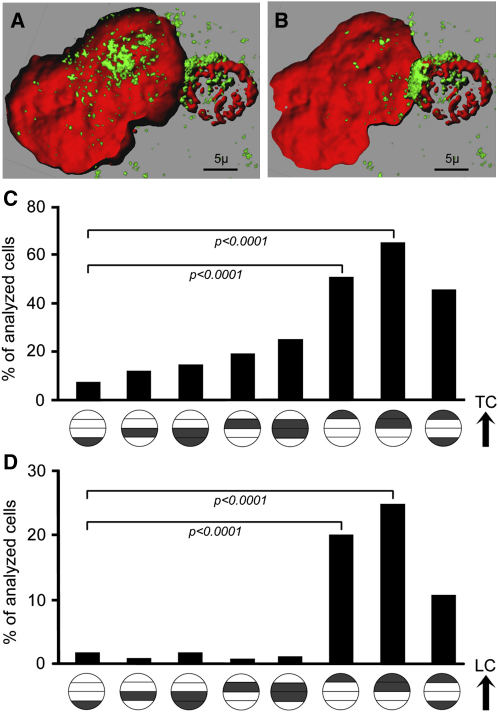
Understanding the initial events in the establishment of vaginal human immunodeficiency virus type-1 (HIV-1) entry and infection has been hampered by the lack of appropriate experimental models. Here, we show in an ex vivo human organ culture system that upon contact in situ, HIV-1 rapidly penetrated both intraepithelial vaginal Langerhans and CD4(+) T cells. HIV-1 entered CD4(+) T cells almost exclusively by CD4 and CCR5 receptor-mediated direct fusion, without requiring passage from Langerhans cells, and overt productive infection ensued. By contrast, HIV-1 entered CD1a(+) Langerhans cells primarily by endocytosis, by means of multiple receptors, and virions persisted intact within the cytoplasm for several days. Our findings shed light on the very earliest steps of mucosal HIV infection in vivo and may guide the design of effective strategies to block local transmission and prevent HIV-1 spread.


Figures

Figure 1
Figure 1
Separation of Vaginal Epithelial Sheets (A) Photograph of suction blisters on surgically excised vaginal mucosa. (B) Hematoxylin-eosin stain of intact suction blister by light microscopy. (C) Blister roofs, i.e., epithelial sheets, floating in PBS after removal from the underlying stroma, visualized under a stereoscope. (D) Epithelial sheets, separated by EDTA treatment. (E) Stereoscopic view of the basal side of a sheet separated by vacuum suction. An organized pattern of rete ridges and depressions, corresponding to the stromal papillae that were pulled out during separation, can be seen. (F) Stereoscopic view of the basal side of an EDTA-separated sheet, exhibiting the same pattern. (G and H) Toluidine blue-stained cross-section of epithelial sheets separated by vacuum suction (G) or ETDA (H), viewed by light microscopy. In the EDTA sheet, the enucleated outer epithelial cells have swollen during the overnight incubation. (I and J) Live/dead cell staining of EDTA-separated sheets. Sheets were stained with calcein AM (live cells, green), ethidium homodimer-1 (nuclei of dead cells, red), and TOPRO-3 (nuclear counterstain, blue) as described in the manufacturer's protocol. Sheets were immersed in glycerol under a coverslip and imaged by confocal microscopy. Stacks covering the complete distance from the basal to the luminal side (toward the vaginal cavity) were acquired, and the sheets were reconstructed in the z-section by Imaris software. (I) In a typical sheet, nearly all cells were alive, staining green, and only few cells at the luminal side were dead, staining red, which represent naturally dying cells that slough off into the vaginal cavity in vivo (two white arrows). (J) Treatment for 1 hr with 1% sodium azide killed all cells, as demonstrated by loss of the green live cell stain and universal acquisition of the red dead cell marker.
Figure 2
Figure 2
Binding and Entry of HIV-1 in Intraepithelial Vaginal T Cells Suction blister sheets were spinoculated for 2 hr with GFP-Vpr-tagged HIV-1JR-CSF, stained for cell-specific markers and analyzed by confocal microscopy. GFP+ virions are shown in green and CD4 in red. Yellow (or white in [E]) signifies coexpression of GFP and CD4. The blue nuclear counterstain is TOPRO-3. (A–C) Clusters of virion binding CD4+ T cells in the vaginal epithelium in two donors ([A] and [B], donor 1; [C], donor 2). (D) Blocking of viral binding with antibodies to CD4 (αCD4) or CCR5 (αCCR5). Viral binding was quantified with an algorithm given in Supplemental Experimental Procedures online. Each dot depicts the percent GFP+ T cells among all CD4+ T cells counted in a distinct, nonoverlapping confocal stack. Each color signifies stacks acquired in the same tissue donor. Horizontal black bars represent the means calculated from the average percentages in each donor. Mock versus αCD4 and αCCR5 blocking (p = 0.007) was evaluated for significance as described in Experimental Procedures. ΔEnv HIV-1 lacks the viral envelope. (E) Three-dimensional reconstruction from a confocal image stack of an intraepithelial CD4+ T cell by Imaris software. The cell was virtually clipped at its widest circumference so that the green virions located inside the cytoplasm, between the red cell membrane and the blue nucleus, can be clearly identified (yellow arrows). Areas where HIV-1 penetrates the cell membrane, signified by CD4 and HIV-1 colocalization, are shown in white color. The nucleus is rendered as an isosurface and virions appear to enter it at one location (white arrowhead). (F–H) Three representative CD4+ T cells exhibiting cytoplasmic entry of virions. Confocal stacks of individual cells were deconvolved with Autodeblur, and viral entry was determined with an algorithm described in Supplemental Experimental Procedures online. The yellow arrowheads in the magnified insets point to areas of viral entry where GFP+ virions are located on the cytoplasmic side along a section of the cell membrane costaining for CD4 and GFP.
Figure 3
Figure 3
Entry of HIV-1 into Intraepithelial Vaginal Langerhans Cells Suction blister sheets were spinoculated for 2 hr with GFP-Vpr-tagged HIV-1JR-CSF, stained for cell-specific markers, and analyzed by confocal microscopy. GFP+ virions are shown in green, CD1a in red. The blue nuclear counterstain TOPRO-3 is rendered more or less transparent. Confocal stacks were recreated in three dimensions with Imaris software. (A–E) Representative virion-containing LC in three different donors ([A] and [B], donor 1; [C], donor 2; [D] and [E], donor 3). x, y, and z planes are rotated in (A) and (B) to illustrate how a virtual clipping plane can be sliced through the tissue to visualize cross-sections. White arrows point to cross-sections of LC containing intracellular HIV-1. Yellow arrows point to virus-laden T cells conjugated to LC. (F) Blocking of viral entry with mannan, CD4 (αCD4), or CCR5 (αCCR5) antibody. Viral entry was quantified with an algorithm given in Supplemental Experimental Procedures online. Each dot depicts the percent GFP+ LC among all CD1a+ LC counted in a distinct, nonoverlapping confocal stack. Each color signifies stacks that were acquired in the same tissue donor. Horizontal black bars represent the means calculated from the average percentages in each donor. Mock versus mannan blocking (p = 0.54) and mock versus αCD4 and αCCR5 blocking (p = 0.008) were evaluated for significance as described in Experimental Procedures.
Figure 4
Figure 4
Electron Microscopy of Viral Interaction with Intraepithelial Lymphocytes and Langerhans Cells Epithelial sheets were spinoculated with HIV-1BaL for 2 hr and processed for electron microscopy. (A–G) Representative images of viral binding to intraepithelial lymphocytes. Black arrows point to bridges forming between viral envelope and cell membrane. The region within the black rectangle in (A) is magnified in (B). (C–G) Images magnified from additional lymphocytes. Cytoplasmic entry of intact, enveloped virions into lymphocytes was not seen. (H and I) A possible HIV-cell membrane fusion event in another lymphocyte. The region within the white rectangle in (H) is magnified in (I). (J and K) Emigrating HIV-1 containing LC in one donor, displaying a long cytoplasmic process retained in the epithelium (black arrows). The region within the white rectangle in (J) is magnified in (K) and demonstrates that the LC process contains a vacuole with one virion inside (black arrowhead). (L–N) HIV-1-containing LC in a different donor. (L) Overview. (M) Cell region indicated by the black rectangle and asterisk in (L), displaying surface-bound virions. (N) Cell region indicated by the white rectangle and asterisk in (L), displaying an endosomal vesicle located adjacent to the cell nucleus and containing one intact virion. (O–Q) Endosomal vesicles found deep inside the cytoplasm, containing intact virions in three additional LC.
Figure 5
Figure 5
Productive HIV-1 Infection in Langerhans and T Cells Emigrating from the Vaginal Epithelium (A) FACS analysis of cells emigrating from an EDTA-separated sheet. Most cells were single T cells (upper left quadrant) and LC-TC conjugates (upper right quadrant). Only few single LC were seen (lower right quadrant). Contaminating epithelial cells are located in the lower left quadrant. Percentages of cells in each quadrant are indicated. (B) Proviral PCR assay for HIV-1 env DNA in cells emigrating from virus-exposed vaginal epithelial sheets separated by vacuum suction in two donors. (C) Alu-LTR PCR assay for integrated HIV-1 DNA in cells emigrating from virus-exposed sheets separated by EDTA in three donors. (B and C) Epithelial sheets were placed for 1 hr in Hanks buffered salt solution containing 5 mM calcium chloride to reverse the reported (Dimitrov et al., 1993; Klimstra et al., 2003) inhibitory effect of calcium depletion on HIV infectivity. Sheets were then exposed to HIV-1 in the presence or absence of AZT for 2 hr, washed vigorously, and cultured in the presence or absence of AZT for 48 hr. Emigrated LC and T cells were harvested and DNA was isolated and subjected to the PCR assays. Abbreviations: a, BaL; b, SF-2; c, BaL + AZT; d, BaL + SF-2; e, BaL + SF-2 + AZT; f, JR-CSF; g, JR-CSF + AZT; NV, no virus; −, no template control; +, infected PHA blasts. (D–H) HIV-1 Gag expression. Vaginal epithelial sheets were exposed to HIV-1JR-CSF in the presence or absence of AZT for 2 hr and washed vigorously. Sheets were then cultured in the presence or absence of AZT for 60 hr, and emigrated LC and T cells were harvested, stained for HIV-1 Gag and cell-specific markers, and analyzed by FACS or fluorescence microscopy. (D) FACS analysis in one tissue donor representative of two. 7-AAD live CD3+ T cells were gated, and the expression of HIV-1 Gag after HIV-1 (−AZT) or HIV-1 + AZT (+AZT) exposure are overlaid as two histograms. The percentages of positive cells, as determined by comparison to IgG isotype staining, are indicated. (E–H) Fluorescence microscopy analysis in one tissue donor representative of three. Gag-specific fluorescence for T cells (E) and LC (F) within LC-TC conjugates was determined as described in Supplemental Experimental Procedures online. Percentages of positive cells are indicated. (G) Example of a Gag+ T cell in an emigrated LC-TC conjugate. Gag expression is shown in green, HLA-DR in red, CD3 in blue, and the nuclear counterstain in gray. (H) Example of a Gag+ LC in an emigrated LC-TC conjugate. (I–L) Electron microscopy of emigrated LC-TC conjugates. Epithelial sheets were spinoculated with HIV-1BaL for 2 hr and cultured for 60 hr. Emigrated LC-TC conjugates were harvested and processed for electron microscopy. (I and J) HIV-1 virions located within the cytoplasm of two emigrated LC. (K and L) HIV-1 virion located in the intercellular space along the contact zone between a T cell and a LC. (M–P) GFP expression from GFP-encoding HIV-1. Vaginal epithelial sheets were exposed for 2 hr to GFP-encoding, single round infection-competent HIV-1, either enveloped with CCR5-tropic SF162 Env (SF162 Env) or Env-deficient (ΔEnv). Sheets were cultured for 60 hr and emigrated LC and T cells were harvested, stained for cell-specific markers, and analyzed by fluorescence microscopy. Example of a GFP+ T cell within an emigrated LC-TC conjugate (M). GFP expression is shown in green, HLA-DR in red, CD3 in blue, and the nuclear counterstain in gray. Maximum GFP intensity for T cells (8258 cells for SF162 Env and 9729 cells for ΔEnv) (N) and LC (819 cells for SF162 Env and 767 cells for ΔEnv) (O) was determined as described in the Supplemental Experimental Procedures online. (P) Comparison of maximum GFP intensity for T cells conjugated to LC versus unconjugated single T cells. In the same sample as in (N), conjugated and unconjugated T cells were categorized by visual inspection on the computer screen and their maximum GFP intensities plotted. A total of 616 conjugated T cells were present in the sample and compared to an equal number of unconjugated T cells. The red lines in (N)–(P) represent an arbitrary positive-negative cut-off. Percentages of positive cells are indicated. Results shown are for one representative donor out of two.
Figure 6
Figure 6
Recruitment of HIV-1 toward the LC-TC Contact Zone (A and B) GFP+ virion distribution in a LC-TC conjugate in situ. Suction blister sheets were spinoculated for 2 hr with GFP-Vpr-tagged HIV-1JR-CSF, stained for cell-specific markers, and analyzed by confocal microscopy. GFP+ virions are shown in green, HLA-DR in red. The blue nuclear counterstain TOPRO-3 is rendered transparent. Confocal stacks were recreated in three dimensions with Imaris software. (C and D) HIV-1 Gag distribution in LC-TC conjugates after emigration. Vaginal epithelial sheets from four donors were exposed to HIV-1JR-CSF for 2 hr, washed vigorously, and cultured for 60 hr. Emigrated LC and T cells were harvested, stained for HIV-1 Gag and cell-specific markers, and analyzed by fluorescence microscopy. The cellular distribution of HIV-1 Gag was categorized and quantified with Metamorph 6.2. Each HIV-1 Gag+ cell within a LC-T cell conjugate was divided into four segments laid out in parallel to the LC-T cell junction, and the fraction of the total green fluorescence signal in each segment was determined. (C) Distribution of HIV Gag in conjugated LC. Each of the circles along the x axis categorizes a specific HIV Gag distribution pattern within the LC. A single dark gray band indicates that at least 50% of the total green fluorescence was found within this segment of the LC. Two dark gray bands indicate that at least 75% of the total green fluorescence was found within these two segments of the LC. The black arrow indicates the orientation of the LC in relationship to the contact zone with the T cell. An individual cell could be assigned to more than one category. As an example, the distribution of HIV Gag in the LC depicted in Figure 5H places the cell into the second, fourth, and fifth categories from the right. p values were determined by two-tailed chi-square test. (D) Distribution of HIV Gag in conjugated T cells. The HIV Gag distribution pattern within each conjugated T cell was categorized as described in (C). The black arrow indicates the orientation of the T cell in relationship to the contact zone with the LC. As an example, the distribution of HIV Gag in the T cell depicted in Figure 5G places the cell into to the first category from the right. p values were determined by two-tailed chi-square test.

Comment in

Similar articles

Cited by

References

    1. Arrighi J.F., Pion M., Garcia E., Escola J.M., van Kooyk Y., Geijtenbeek T.B., Piguet V. DC-SIGN-mediated infectious synapse formation enhances X4 HIV-1 transmission from dendritic cells to T cells. J. Exp. Med. 2004;200:1279–1288. - PMC - PubMed
    1. Brussel A., Sonigo P. Analysis of early human immunodeficiency virus type 1 DNA synthesis by use of a new sensitive assay for quantifying integrated provirus. J. Virol. 2003;77:10119–10124. - PMC - PubMed
    1. Cheng-Mayer C., Liu R., Landau N.R., Stamatatos L. Macrophage tropism of human immunodeficiency virus type 1 and utilization of the CC-CKR5 coreceptor. J. Virol. 1997;71:1657–1661. - PMC - PubMed
    1. Collins K.B., Patterson B.K., Naus G.J., Landers D.V., Gupta P. Development of an in vitro organ culture model to study transmission of HIV-1 in the female genital tract. Nat. Med. 2000;6:475–479. - PubMed
    1. Dimitrov D.S., Broder C.C., Berger E.A., Blumenthal R. Calcium ions are required for cell fusion mediated by the CD4-human immunodeficiency virus type 1 envelope glycoprotein interaction. J. Virol. 1993;67:1647–1652. - PMC - PubMed

Publication types