. 2007 Mar 7;26(5):1234-44.
doi: 10.1038/sj.emboj.7601595. Epub 2007 Feb 15.

C-terminal Src kinase controls development and maintenance of mouse squamous epithelia

Affiliations

C-terminal Src kinase controls development and maintenance of mouse squamous epithelia

Reiko Yagi et al. EMBO J. .

Abstract

Carboxy-terminal Src kinase (Csk) is a negative regulator of Src family kinases, which play pivotal roles in controlling cell adhesion, migration, and cancer progression. To elucidate the in vivo role of Csk in epithelial tissues, we conditionally inactivated Csk in squamous epithelia using the keratin-5 promoter/Cre-loxP system in mice. The mutant mice developed apparent defects in the skin, esophagus, and forestomach, with concomitant hyperplasia and chronic inflammation. Histology of the mutant epidermis revealed impaired cell-cell adhesion in basal cell layers. Analysis of primary keratinocytes showed that the defective cell-cell adhesion was caused by cytoskeletal remodeling via activation of the Rac1 pathway. Mutant keratinocytes also showed elevated expression of mesenchymal proteins, matrix metalloproteinases (MMPs), and the proinflammatory cytokine TNF-alpha. Inhibition of the expression of TNF-alpha and MMP9 by the anti-inflammatory reagent FK506 could cure the epidermal hyperplasia, suggesting a causal link between inflammation and epidermal hyperplasia. These observations demonstrate that the Src/Csk circuit plays crucial roles in development and maintenance of epithelia by controlling cytoskeletal organization as well as phenotypic conversion linked to inflammatory events.


Figures
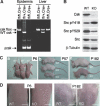
Figure 1
Figure 1
Phenotype of K5 csk-KO mice. (A) Genotyping of K5 csk-KO mice. Genomic DNA was prepared from epidermis or liver from cskflox/flox mice (fl/fl, Cre−), K5-Cre, cskflox/+ mice (fl/+, Cre+), or K5 Cre, cskflox/flox mice (fl/fl, Cre+), and genotyped by PCR. (B) Keratinocytes were cultured from wild-type (WT) and K5 csk-KO (KO) newborn mice, and whole-cell lysates of undifferentiated cells were subjected to immunoblotting with antibodies to the indicated proteins and phosphorylation sites. (C) Gross appearance of KO and WT littermates at P6 (a), P57 (b), and P182 (c). Scale bars: a, 1 cm, b and c, 5 cm. (D) Skin of KO and WT littermates at P6 and P182. At P182, hair was removed to reveal the appearance of the skin. Scale bars: P6, 0.3 cm, P182, 1 cm.
Figure 2
Figure 2
Histology of the dorsal skin and esophagus. (A) HE-stained skin sections of K5 csk-KO mice at P29 (d) and P218 (e), and those of corresponding wild-type littermates (a and b). Scale bars: 20 μm. Higher magnification views of (b) and (e) are shown in (c) and (f), respectively. Yellow arrows indicate infiltrating lymphocytes. Scale bars: 3 μm. (B) The numbers of epidermal cell layers in dorsal skin sections were counted at the indicated stages. Data are means±s.d. The numbers of mice examined are shown in parentheses. (C) Skin sections of wild-type and mutant mice were stained for T lymphocytes (a and c: Thy1.2-positive) and macrophages (b and d: CD11b-positive). Neutrophils were stained using PAS. Wounded skin was stained as a positive control. Scale bars: 10 μm. (D) Inflammation was quantified by the presence of lymphocytes infiltrating the dermis for the same mice used in (B). The ratios of inflamed mice to the total number of mice examined are indicated.
Figure 3
Figure 3
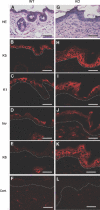
Immunohistochemical analysis of the dorsal skin of K5 csk-KO mice. Dorsal skin sections from wild-type littermates (A–F) and K5 csk-KO mice (G–L) were stained with HE (A and G) and subjected to immunofluorescent staining with antibodies to marker proteins: K5 (B and H), K1 (C and I), involucrin (Inv; D and J), and K6 (E and K). Staining of serial sections is shown. Control staining (without primary antibody) gave no significant signal (Cont.). The dotted white line shows the epidermal–dermal border. Scale bars: 10 μm.
Figure 4
Figure 4
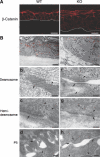
Cell adhesion structures in the dorsal skin of K5 csk-KO mice. (A) Dorsal skin sections from wild-type littermates (a) and K5 csk-KO mice (b) were subjected to immunofluorescent staining with anti-β-catenin to observe adherence junctions. The dotted white line represents the epidermal–dermal border. Scale bars: 5 μm. (B) Electron microscopic analysis of dorsal skin sections from wild-type littermates (a–d) and K5 csk -KO mice (e–h). Desmosomal structures are indicated by small red circles in (a) and (e). Scale bars: 2 μm. Higher magnification (× 60 000) images of a desmosome (b and f) and a hemidesmosome (c and g) are shown. Scale bar: 0.1 μm. Higher magnification images of dorsal skin sections at P5 are shown in (d) and (h). Scale bar: 0.2 μm. Desmosome/hemidesmosome and keratin filaments are indicated by arrows and arrowheads, respectively.
Figure 5
Figure 5
Characterization of primary cultured K5 csk-KO keratinocytes. (A) Wild type (WT) and K5 csk-KO (KO) keratinocytes were treated with 1 mM Ca2+ for the indicated periods and then immunostained with anti-E-cadherin (green). Insets are higher magnification views. Scale bars: 10 μm. (B) WT and KO keratinocytes treated with 1 mM Ca2+ for 8 h were stained with anti-plakoglobin (PG; green) and anti-K5 (red). Merged images are shown. Scale bars: 5 μm. (C) The levels of E-cadherin (E-cad), β-catenin (β-cat), and plakoglobin (PG) during keratinocyte differentiation were examined by immunoblotting. (D) E-cadherin, β-catenin, and plakoglobin were immunoprecipitated from cell lysates prepared before or after 24 h of differentiation (left panels), and tyrosine phosphorylation was detected by immunoblotting with the 4G10 antibody (right panels).
Figure 6
Figure 6
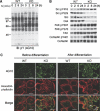
Cellular events in K5 csk-KO keratinocytes. (A) Wild-type (WT) and K5 csk-KO (KO) keratinocytes were induced to differentiate for the indicated periods, and the cell lysates were subjected to immunoblotting with the 4G10 antibody. (B) The samples used in (A) were probed with antibodies to the indicated phosphorylation sites and proteins. (C) WT and KO keratinocytes were costained with 4G10 (green) and Alexa594-phalloidin (red) before and after differentiation (8 h). Merged images are also shown. Podosome-like punctate structures are indicated by arrows. Scale bars: 5 μm.
Figure 7
Figure 7
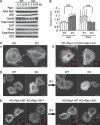
Rac1-mediated cytoskeletal remodeling in K5 csk-KO keratinocytes. (A) Cell lysates prepared from wild-type (WT) and KO keratinocytes at the indicated differentiation stages were incubated with GST-PAK-CRIB, and activated Rac1 was pulled down with glutathione–Sepharose beads. Bound, activated Rac1 (Rac1) and Rac1 in the cell lysates (total Rac1) were detected by immunoblotting with anti-Rac1. GST-PAK-CRIB was detected with anti-GST (GST). Similar assays were performed to detect Cdc42 activity (middle panels). RhoA activity was detected using GST-Rhotekin (lower panels). (B) Signal intensities in the blots for Rac1 (A) were quantified using Image J (NIH), and the relative ratios of activated Rac1 to total Rac1 and activated RhoA to total RhoA were plotted. Data are means±s.e. of three independent assays (t-test; ***P<0.001). (C) WT and KO keratinocytes expressing GFP-actin were monitored for 1 h by time-lapse confocal microscopy. Fluorescent signals for GFP-actin are shown in white (a; Supplementary Movie). Small fillopodia-like structures are shown by arrows (a). WT keratinocytes coexpressing GFP-actin and constitutively active Rac1 (Rac1-V12) and KO keratinocytes coexpressing GFP-actin and dominant negative Rac1 (Rac1-N17) were monitored (b; Supplementary Movie). Fluorescent signals for mRFP-Rac1 are shown in red (insets). (D) WT and KO keratinocytes expressing GFP-actin were treated with 1 mM Ca2+ and monitored for 8 h (Supplementary Movie). Images before (a) and after (b) treatment with Ca2+ are shown. (E) KO keratinocytes expressing WT Rac1 (Rac1-WT) or Rac1-N17 were treated with 1 mM Ca2+ and monitored for 8 h (Supplementary Movie). Images before (a) and after (b) treatment with Ca2+ are shown. Fluorescent signals for mRFP-Rac1 are shown in red (insets). Scale bars: 5 μm.
Figure 8
Figure 8
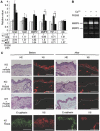
Effects of FK506 treatment on keratinocytes and epidermis in K5 csk-KO mice. (A) Expression of proinflammatory factors and EMT markers in K5 csk-KO keratinocytes. Expression of the indicated genes in wild-type (WT) and K5 csk-KO (KO) keratinocytes treated in the presence or absence of FK506 (20 nM) was quantified by real-time PCR. Values relative to nontreated WT controls are shown in the upper graph (mean±s.e. of five independent experiments, t-test; **P<0.01, *P<0.05). Actual mean values are shown in the lower table. (B) Zymogram of MMP activity. Conditioned medium was prepared from K5 csk-KO keratinocytes treated with the indicated reagents and then subjected to zymography in a gelatin-containing gel. Positions corresponding to MMP9 and MMP2 are indicated by the arrows. (C) The skin of K5 csk-KO mice (KO) was treated with FK506 ointment or control vehicle (petroleum jelly). The skin of WT mice was treated with FK506 as a control. Dorsal skin sections stained with HE and anti-K6 before (left) and after (right) treatment are shown. Frequencies (n=affected individuals/total individuals) are shown in parentheses. The skin of K5 csk-KO mice (KO) was further subjected to staining for E-cadherin before and after treatment with FK506 (lower panels). The dotted white line represents the epidermal–dermal border. Scale bars: 10 μm.

Similar articles

Cited by

References

    1. Aki D, Mashima R, Saeki K, Minoda Y, Yamauchi M, Yoshimura A (2005) Modulation of TLR signalling by the C-terminal Src kinase (Csk) in macrophages. Genes Cells 10: 357–368 - PubMed
    1. Avizienyte E, Frame MC (2005) Src and FAK signalling controls adhesion fate and the epithelial-to-mesenchymal transition. Curr Opin Cell Biol 17: 542–547 - PubMed
    1. Bates RC, Mercurio AM (2003) Tumor necrosis factor-alpha stimulates the epithelial-to-mesenchymal transition of human colonic organoids. Mol Biol Cell 14: 1790–1800 - PMC - PubMed
    1. Behrens J, Vakaet L, Friis R, Winterhager E, Van Roy F, Mareel MM, Birchmeier W (1993) Loss of epithelial differentiation and gain of invasiveness correlates with tyrosine phosphorylation of the E-cadherin/beta-catenin complex in cells transformed with a temperature-sensitive v-SRC gene. J Cell Biol 120: 757–766 - PMC - PubMed
    1. Braga VM, Yap AS (2005) The challenges of abundance: epithelial junctions and small GTPase. Curr Opin Cell Biol 17: 466–474 - PubMed

Publication types

MeSH terms