

Abnormal activation and cytokine spectra in lymph nodes of people chronically infected with HIV-1
- PMID: 17289812
- PMCID: PMC1885500
- DOI: 10.1182/blood-2006-11-055764
Abnormal activation and cytokine spectra in lymph nodes of people chronically infected with HIV-1
Abstract
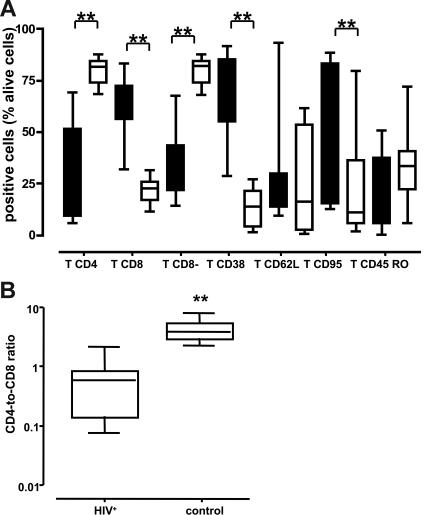
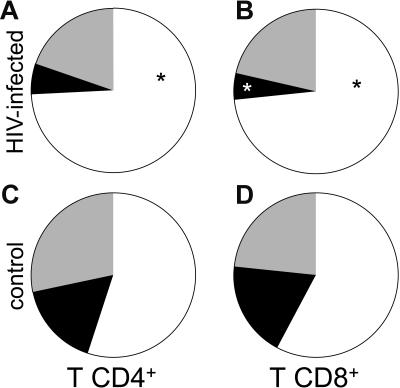
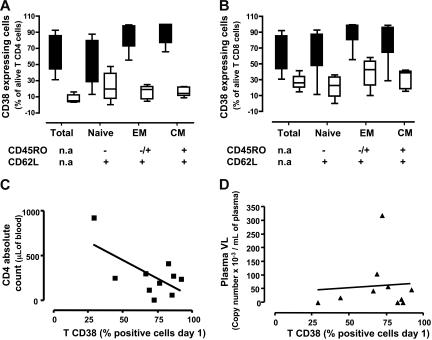
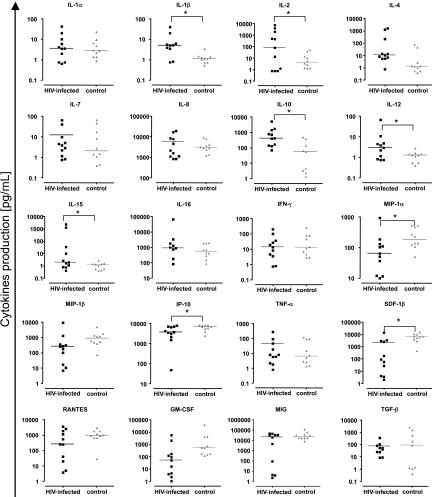
There is growing recognition that HIV-1 infection leads to an activation of the immune system that includes perturbations of cytokine expression, redistribution of lymphocyte subpopulations, cell dysfunction, and cell death. Here, we explored the relationships between HIV-1 infection and immune activation in chronically HIV-1-infected human lymph nodes. In addition to CD4 T-cell depletion, we found increased effector T-cell frequencies associated with profound up-regulation of an activation marker CD38 in naive, central memory, and effector CD4(+) and CD8(+) T cells. Likewise, Fas death receptor (CD95) was more frequently detectable on T cells from HIV-1 nodes. Dendritic cell (DC) depletion was dramatic, with plasmacytoid DCs (PDCs) 40-fold and myeloid DCs (MDCs) 20-fold less frequent in HIV(+) nodes than in control nodes. Cytokine dysregulation was evident, with IL-2 and IL-15 as much as 2 or 3 logs greater in infected nodes than in control nodes. Thus, activated effector cells are inappropriately attracted and/or retained in lymphoid tissue in chronic HIV-1 infection. High-level cytokine expression in turn activates and retains more cells at these sites, leading to lymphadenopathy and massive bystander activation that characterizes HIV-1 infection. Strategies targeting these activation pathways may lead to new therapies.
Figures

Similar articles
-
Effects of HIV-1 infection on lymphocyte phenotypes in blood versus lymph nodes.J Acquir Immune Defic Syndr. 2005 Aug 15;39(5):507-18. J Acquir Immune Defic Syndr. 2005. PMID: 16044000
-
Short Intracellular HIV-1 Transcripts as Biomarkers of Residual Immune Activation in Patients on Antiretroviral Therapy.J Virol. 2016 May 27;90(12):5665-5676. doi: 10.1128/JVI.03158-15. Print 2016 Jun 15. J Virol. 2016. PMID: 27030274 Free PMC article.
-
Differential upregulation of CD38 on different T-cell subsets may influence the ability to reconstitute CD4+ T cells under successful highly active antiretroviral therapy.J Acquir Immune Defic Syndr. 2005 Apr 1;38(4):373-81. doi: 10.1097/01.qai.0000153105.42455.c2. J Acquir Immune Defic Syndr. 2005. PMID: 15764953
-
Cell cycle dysregulation during HIV infection: perspectives of a target based therapy.Curr Drug Targets Immune Endocr Metabol Disord. 2002 Apr;2(1):53-61. Curr Drug Targets Immune Endocr Metabol Disord. 2002. PMID: 12477296 Review.
-
The role of CD38 in HIV infection.AIDS Res Ther. 2021 Apr 5;18(1):11. doi: 10.1186/s12981-021-00330-6. AIDS Res Ther. 2021. PMID: 33820568 Free PMC article. Review.
Cited by
-
Kynurenine Reduces Memory CD4 T-Cell Survival by Interfering with Interleukin-2 Signaling Early during HIV-1 Infection.J Virol. 2016 Aug 12;90(17):7967-79. doi: 10.1128/JVI.00994-16. Print 2016 Sep 1. J Virol. 2016. PMID: 27356894 Free PMC article.
-
CXCR3 enables recruitment and site-specific bystander activation of memory CD8+ T cells.Nat Commun. 2019 Nov 1;10(1):4987. doi: 10.1038/s41467-019-12980-2. Nat Commun. 2019. PMID: 31676770 Free PMC article.
-
HIV-1 elite controllers present a high frequency of activated regulatory T and Th17 cells.PLoS One. 2020 Feb 5;15(2):e0228745. doi: 10.1371/journal.pone.0228745. eCollection 2020. PLoS One. 2020. PMID: 32023301 Free PMC article.
-
Immunologic failure despite suppressive antiretroviral therapy is related to activation and turnover of memory CD4 cells.J Infect Dis. 2011 Oct 15;204(8):1217-26. doi: 10.1093/infdis/jir507. J Infect Dis. 2011. PMID: 21917895 Free PMC article.
-
A divergent myeloid dendritic cell response at virus set-point predicts disease outcome in SIV-infected rhesus macaques.J Med Primatol. 2011 Aug;40(4):206-13. doi: 10.1111/j.1600-0684.2011.00484.x. Epub 2011 Jul 1. J Med Primatol. 2011. PMID: 21718317 Free PMC article.
References
-
- Mofenson LM, Korelitz J, Meyer WA, 3rd, et al. The relationship between serum human immunodeficiency virus type 1 (HIV-1) RNA level, CD4 lymphocyte percent, and long-term mortality risk in HIV-1-infected children: National Institute of Child Health and Human Development Intravenous Immunoglobulin Clinical Trial Study Group. J Infect Dis. 1997;175:1029–1038. - PubMed
-
- Palumbo PE, Raskino C, Fiscus S, et al. Predictive value of quantitative plasma HIV RNA and CD4+ lymphocyte count in HIV-infected infants and children. JAMA. 1998;279:756–761. - PubMed
-
- Mattapallil JJ, Douek DC, Hill B, Nishimura Y, Martin M, Roederer M. Massive infection and loss of memory CD4+ T cells in multiple tissues during acute SIV infection. Nature. 2005;434:1093–1097. - PubMed
-
- Meyaard L, Schuitemaker H, Miedema F. T-cell dysfunction in HIV infection: anergy due to defective antigen-presenting cell function? Immunol Today. 1993;14:161–164. - PubMed
-
- Douek DC, Picker LJ, Koup RA. T cell dynamics in HIV-1 infection. Annu Rev Immunol. 2003;21:265–304. - PubMed
Publication types
MeSH terms
Substances
Grants and funding
LinkOut - more resources
Full Text Sources
Other Literature Sources
Medical
Research Materials
Miscellaneous
