. 2007 Apr 1;501(4):631-46.
doi: 10.1002/cne.21283.

Differential expression of class 3 and 4 semaphorins and netrin in the lamprey spinal cord during regeneration

Affiliations

Differential expression of class 3 and 4 semaphorins and netrin in the lamprey spinal cord during regeneration

Michael I Shifman et al. J Comp Neurol. .

Abstract

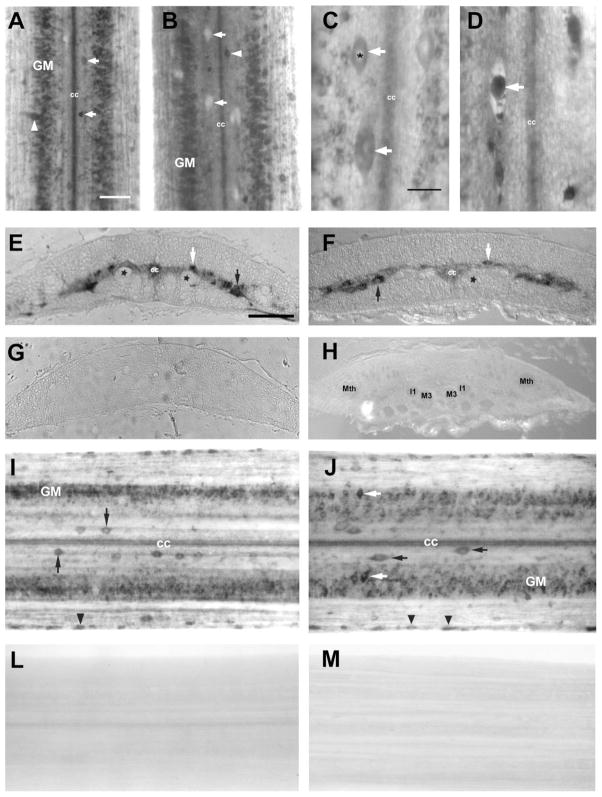
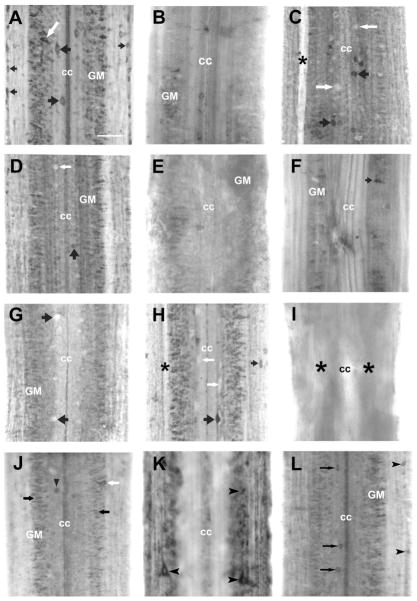
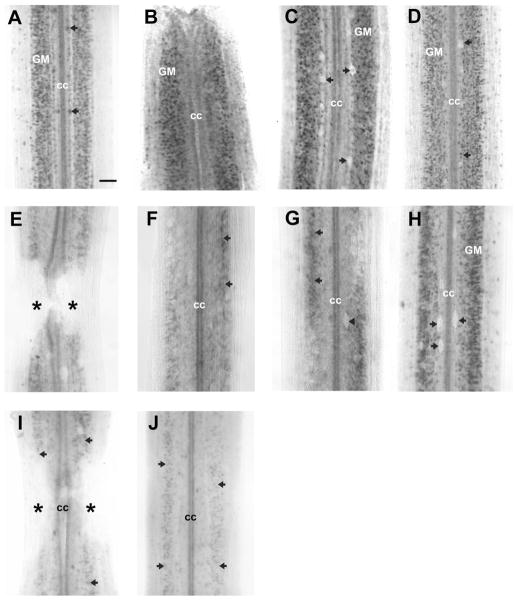
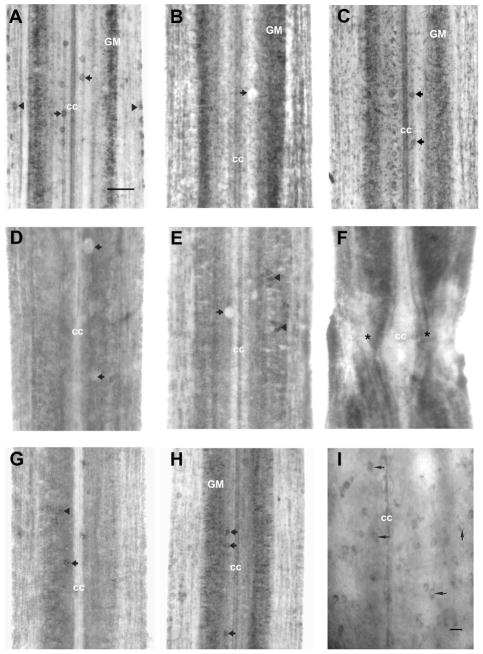
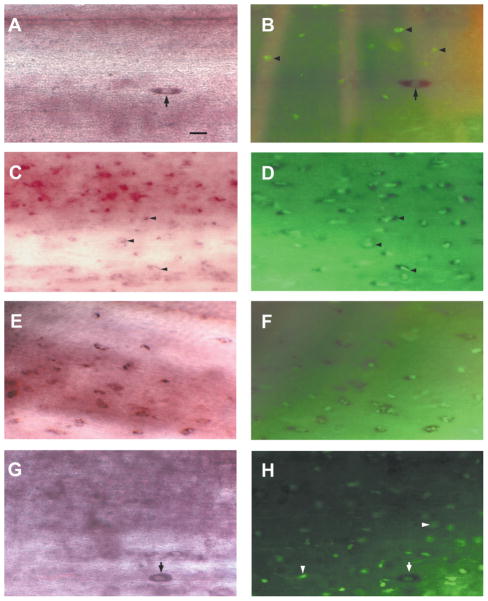
To explore the role of axon guidance molecules during regeneration in the lamprey spinal cord, we examined the expression of mRNAs for semaphorin 3 (Sema3), semaphorin 4 (Sema4), and netrin during regeneration by in situ hybridization. Control lampreys contained netrin-expressing neurons along the length of the spinal cord. After spinal transection, netrin expression was downregulated in neurons close (500 mum to 10 mm) to the transection at 2 and 4 weeks. A high level of Sema4 expression was found in the neurons of the gray matter and occasionally in the dorsal and the edge cells. Fourteen days after spinal cord transection Sema4 mRNA expression was absent from dorsal and edge cells but was still present in neurons of the gray matter. At 30 days the expression had declined to some extent in neurons and was absent in dorsal and edge cells. In control animals, Sema3 was expressed in neurons of the gray matter and in dorsal and edge cells. Two weeks after transection, Sema3 expression was upregulated near the lesion, but absent in dorsal cells. By 4 weeks a few neurons expressed Sema3 at 20 mm caudal to the transection but no expression was detected 1 mm from the transection. Isolectin I-B(4) labeling for microglia/macrophages showed that the number of Sema3-expressing microglia/macrophages increased dramatically at the injury site over time. The downregulation of netrin and upregulation of Sema3 near the transection suggests a possible role of netrin and semaphorins in restricting axonal regeneration in the injured spinal cord.


Figures

Fig. 1
Fig. 1
The gross cytoarchitecture of the lamprey spinal cord after transection. Photomicrographs obtained at 30 days postinjury showing the spinal cord: control (A) and transected (B). The gross cytoarchitecture of the spinal cord caudal to the lesion site remained largely intact and spinal “gray matter” could be discerned clearly in whole-mounts that were stained with Toluidine blue. Most neuronal and glial cell bodies are located in the central “gray matter” (GM) with axon tracts surrounding them (A,B). Dorsal cells are identified with white arrows and lateral cells with white arrowhead (A). Note lack of Nissl staining in dorsal cells (B, white arrows) after spinal cord transection. C,D: Dorsal cells exhibited pronounced morphological changes after spinal cord injury. Note the degenerative morphological features of a dorsal cell perikaryon in the transected spinal cord, exhibiting condensed cytoplasm (white arrow in D), compared with a normal dorsal cell in the uninjured spinal cord (C). C: asterisks, nucleus of dorsal cell; white arrow, dorsal cells; cc, central canal. D: white arrow, condensed dorsal cells; cc, central canal. Toluidine blue O stain. E–M: Adequacy of probe penetration and sense probe control. E: Sema3 mRNA in situ hybridization on paraffin sections of the spinal cord showed intense labeling of neurons in gray matter, dorsal cells (white arrow), and probably lateral interneurons (black arrow). A similar distribution was observed for netrin mRNA in situ signal (F). Dorsal cells (white arrow) and probably lateral interneurons (black arrow). Asterisks, axons; cc, central canal. Control DIG-labeled sense Sema3 RNA (G) and netrin RNA (H) probes did not produce a hybridization signal; Mth, Mauthner axon; I1 and M3, axons of reticulospinal neurons I1 and M3. The spinal cord wholemount in situ hybridization showed abundant Sema3 (I) and netrin (J) mRNA expression with distribution of labeled neurons very similar to signal distribution after in situ hybridization on paraffin sections. I: GM, gray matter; cc, central canal; black arrows point to dorsal cells and black arrowhead: edge cells. J: GM, gray matter; cc, central canal; black arrows point to dorsal cells; white arrow: lateral interneurons and black arrowhead: edge cells. Wholemounted spinal cords were hybridized with control DIG-labeled sense Sema3 (L) and netrin (M) RNA probes and had no labeling. Scale bars = 100 μm in A,E (applies to E–M); 20 μm in C.
Fig. 2
Fig. 2
Expression of netrin mRNA in the spinal cord after transection. Rostral is top in all micrographs. The entire width of the cord is seen. A: In situ hybridization in wholemounted control spinal cord shows labeling for lamprey netrin very prominently in dorsal cells (black arrows), in neurons of the spinal gray matter (GM) (white arrow), and in the edge cells (small black arrows). The ependymal cells lining the central canal (cc) also express netrin. B–D: Netrin mRNA expression 2 weeks after spinal cord transection. B,C: Netrin mRNA expression was strongly downregulated 500 μm caudal and rostral to transection in the neurons of the spinal gray matter (GM). Only a few dorsal cells (black arrows) expressed netrin mRNA, while most dorsal cells stopped expressing netrin mRNA (the clear silhouettes of dorsal cells are indicated by white arrows); asterisk: a swollen, degenerating Mauthner axon. D: Typical, though much less intensely labeled, netrin-expressing neurons remained in the spinal gray matter (GM) far (1 cm) from the transection site; a few dorsal cells continued to express netrin mRNA (black arrow), while most dorsal cells stopped expressing netrin mRNA; a clear DC silhouette is indicated by white arrow. E–H: By 4 weeks posttransection, no netrin-expressing neurons were found 500 μm caudal (E) or rostral (F) to the transection site; 1 mm caudal to transection site (G) a few neurons in the spinal cord gray matter (GM) express netrin mRNA but dorsal cells do not; the clear silhouettes of dorsal cells are indicated by black arrows. H: Netrin expression in neurons of the spinal gray matter 10 mm caudal to the transection was almost at pretransection levels; however, most dorsal cells still did not express netrin (white arrow). A netrin-expressing dorsal cell is indicated by the large black arrow and an edge cell indicated by the small black arrow; asterisk: swollen degenerating Mauthner axon. I–L: Netrin mRNA expression 5 months after spinal cord transection. I: Absence of in situ hybridization signal for netrin in spinal cord around transection site; cc, central canal; asterisks, transection site. J–L: Netrin mRNA expression gradually returned to prelesion levels. J: Netrin expression in neurons of the spinal gray matter (black arrows), a dorsal cell (black arrowhead), and a lateral cell (white arrow) located ≈500 μm caudal to the transection site. K: 500 μm rostral to the transection site several neurons expressing netrin mRNA (black arrowheads). Further caudal from the transection, 10 mm (L) netrin in situ hybridization patterns were similar to those in control animals; label was seen in dorsal cells (black arrows), edge cells (black arrowheads), and neurons of the spinal gray matter (GM) and in the ependymal cells lining the central canal (cc). Scale bar = 100 μm in A (applies to all).
Fig. 3
Fig. 3
Effect of transection on expression of Sema4 mRNA. In situ hybridization was performed in spinal cord wholemounts. Rostral is top in all micrographs. The entire width of the cord is seen. A: In control animals, labeling for Sema4 was seen prominently in dorsal cells (black arrows), neurons of the gray matter (GM), and in the ependymal cells lining the central canal (cc). B–D: At 2 weeks post-transection, Sema4 mRNA expression was not changed at the transection site (B) and 500 μm caudal to transection (C) and 10 mm caudal to the lesion (D), except for disappearance of Sema4 mRNA expression in dorsal cells. The unlabeled silhouettes of dorsal cells are indicated by black arrows. E: At 30 days, semaphorin-positive cells surrounded the lesion site but never were found in the scar region; asterisks: transection site. F,G: By 4 weeks posttransection, fewer neurons (black arrows) expressed Sema4 mRNA 500 μm rostral (F) and caudal (G) to transection. The silhouette of an unlabeled dorsal cell is indicated by the black arrowhead. H: With increasing distance from the transection, expression of Sema4 mRNA appeared in the usual distribution, although at 10 mm it remained less than control, and expression was absent in dorsal cells. I,J: At 5 months after spinal cord transection, Sema4 mRNA expression was downregulated in neurons of the spinal gray matter (black arrows) around transection site (I) and at 2 mm caudal to the lesion (J), and expression was absent in dorsal cells and edge cells (J); cc, central canal; asterisks, transection site. Scale bar = 100 μm in A (applies to all).
Fig. 4
Fig. 4
Effect of transection on expression of Sema3 mRNA. Rostral is top in all micrographs. The entire width of the cord is seen. A: In situ hybridization in control spinal cord wholemount shows labeled dorsal cells (black arrows) and medium-sized neurons in the lateral gray matter (GM). Label was also found in the glial/ependymal cells surrounding the central canal (cc) and in most edge cells (black arrowhead). B,C: Two weeks after spinal cord transection. B: Sema3 mRNA expression was upregulated near the lesion site (1 mm) compared to control animals, although expression was absent in dorsal cells (black arrow); cc, central canal. C: The intensity of labeling decreased with distance from the transection but it was above control levels 20 mm caudal to the transection; dorsal cells (black arrow); cc, central canal. D–F: One month after transection. D: No neurons expressed Sema3 mRNA at 1 mm caudal to the transection site; the clear silhouettes of dorsal cells are indicated by white arrows; cc, central canal. High background is seen on this frame due to nonspecific binding of label to cellular debris and blood cells entering the transection site. E: More caudally (20 mm), a few neurons in the spinal cord gray matter expressed Sema3 mRNA (black arrowheads) but dorsal cells remained unlabeled (black arrows point to the silhouettes of dorsal cells); cc, central canal. F: Five months after spinal cord transection Sema3 mRNA expression was not detected at the lesion site (asterisks: transection site). G: Reduced level of Sema3 mRNA expression was detected 1 mm caudal from the transection site in neurons (black arrowhead) of the spinal gray matter and in some dorsal cells (black arrow). H: expression increased with distance from the transection, but the intensity of Sema3-specific in situ hybridization signal and the number of Sema3-producing neurons were still noticeably reduced at 20 mm. Labeling was found primarily in medium-sized neurons in the spinal gray matter (GM) and in dorsal cells (black arrows); cc, central canal. I: Microglial cells that expressed Sema3 were located on the surface of the spinal cord (black arrows). Scale bars = 100 μm in A; 20 μm in I.
Fig. 5
Fig. 5
Microglial activation after spinal cord transection. Rostral is top in all micrographs. The entire width of the cord is seen. A: In situ hybridization in control spinal cord wholemount shows slender, elongated Sema3-expressing cells (black arrow) on the surface of the spinal cord. B: Fluorescein-labeled GSL I-isolectin B4 histochemistry reveals several lectin-labeled cells in control spinal cord (black arrowheads) but Sema3-expressing cells were not labeled (black arrow). C,D: Two weeks after spinal cord transection. C: At 14 days following injury increased numbers of small, rounded cells (black arrowheads), reminiscent of activated microglia/macrophages, were labeled with Sema3. D: A dense accumulation of reactive macrophages/microglial cells, as evidenced by increasing IB4-lectin reactivity, was seen in the spinal cord 2 weeks after transection. Most of the lectin-labeled cells coexpressed Sema3 mRNA (black arrowheads). E,F: One month after transection. E: Localization and shape of Sema3-expressing microglia/macrophages resembled that at 14 days. F: Intense lectin reactivity was seen in the spinal cord 4 weeks after transection. G,H: Microglial expression of Sema3 5 months after spinal cord transection. G: Only a few Sema3-positive cells were detected in the spinal cord 5 months after injury. Some slender, elongated Sema3-expressing cells (black arrowheads) resembled macrophages/microglial cells in control spinal cord (black arrow). H: Numerous macrophages/microglial cells (white arrowheads) could be detected by labeling with IB4 lectin in the spinal cord 5 months after injury. However, these never labeled with the Sema3 RNA probes. On the other hand, there were many elongated Sema3-expressing cells, but these were not reactive macrophages/microglial cells, as evidenced by lack of IB4-lectin reactivity (white arrow). Scale bar = 20 μm in A (applies to all).

Similar articles

Cited by

References

    1. Armstrong J, Zhang L, McClellan AD. Axonal regeneration of descending and ascending spinal projection neurons in spinal cord-transected larval lamprey. Exp Neurol. 2003;180:156–166. - PubMed
    1. Bagnard D, Lohrum M, Uziel D, Puschel AW, Bolz J. Semaphorins act as attractive and repulsive guidance signals during the development of cortical projections. Development. 1998;125:5043–5053. - PubMed
    1. Batchelor PE, Porritt MJ, Martinello P, Parish CL, Liberatore GT, Donnan GA, Howells DW. Macrophages and microglia produce local trophic gradients that stimulate axonal sprouting toward but not beyond the wound edge. Mol Cell Neurosci. 2002;21:436–453. - PubMed
    1. Boya J, Carbonell AL, Calvo JL, Borregon A. Microglial cells in the central nervous system of the rabbit and rat: cytochemical identification using two different lectins. Acta Anat (Basel) 1991;140:250–253. - PubMed
    1. Braisted JE, Catalano SM, Stimac R, Kennedy TE, Tessier-Lavigne M, Shatz CJ, O’Leary DD. Netrin-1 promotes thalamic axon growth and is required for proper development of the thalamocortical projection. J Neurosci. 2000;20:5792–5801. - PMC - PubMed

Publication types

MeSH terms