Estrogen receptor alpha regulates expression of the breast cancer 1 associated ring domain 1 (BARD1) gene through intronic DNA sequence
- PMID: 17275994
- PMCID: PMC1933484
- DOI: 10.1016/j.mce.2007.01.001
Estrogen receptor alpha regulates expression of the breast cancer 1 associated ring domain 1 (BARD1) gene through intronic DNA sequence
Abstract
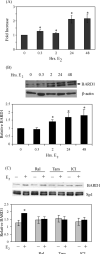
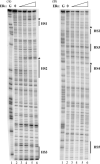
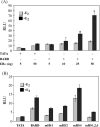
We have used a chromatin immunoprecipitation (ChIP)-based cloning strategy to isolate and identify genes associated with estrogen receptor alpha (ERalpha) in MCF-7 human breast cancer cells. One of the gene regions isolated was a 288bp fragment from the ninth intron of the breast cancer 1 associated ring domain (BARD1) gene. We demonstrated that ERalpha associated with this region of the endogenous BARD 1 gene in MCF-7 cells, that ERalpha bound to three of five ERE half sites located in the 288bp BARD1 region, and that this 288bp BARD1 region conferred estrogen responsiveness to a heterologous promoter. Importantly, treatment of MCF-7 cells with estrogen increased BARD1 mRNA and protein levels. These findings demonstrate that ChIP cloning strategies can be utilized to successfully isolate regulatory regions that are far removed from the transcription start site and assist in identifying cis elements involved in conferring estrogen responsiveness.
Figures


Similar articles
-
Functional genomics identifies a mechanism for estrogen activation of the retinoic acid receptor alpha1 gene in breast cancer cells.Mol Endocrinol. 2005 Jun;19(6):1584-92. doi: 10.1210/me.2005-0040. Epub 2005 Apr 14. Mol Endocrinol. 2005. PMID: 15831516
-
Estrogen receptor-dependent regulation of CYP2B6 in human breast cancer cells.Biochim Biophys Acta. 2010 May-Jun;1799(5-6):469-79. doi: 10.1016/j.bbagrm.2010.01.005. Epub 2010 Jan 14. Biochim Biophys Acta. 2010. PMID: 20079471 Free PMC article.
-
Novel estrogen receptor-alpha binding sites and estradiol target genes identified by chromatin immunoprecipitation cloning in breast cancer.Cancer Res. 2007 May 15;67(10):5017-24. doi: 10.1158/0008-5472.CAN-06-3696. Cancer Res. 2007. PMID: 17510434
-
Endocrine therapy resistance can be associated with high estrogen receptor alpha (ERalpha) expression and reduced ERalpha phosphorylation in breast cancer models.Endocr Relat Cancer. 2006 Dec;13(4):1121-33. doi: 10.1677/erc.1.01257. Endocr Relat Cancer. 2006. PMID: 17158758
-
Matters of life and death: How estrogen and estrogen receptor binding to the immunoglobulin heavy chain locus may influence outcomes of infection, allergy, and autoimmune disease.Cell Immunol. 2019 Dec;346:103996. doi: 10.1016/j.cellimm.2019.103996. Epub 2019 Oct 25. Cell Immunol. 2019. PMID: 31703914 Free PMC article. Review.
Cited by
-
Widespread seasonal gene expression reveals annual differences in human immunity and physiology.Nat Commun. 2015 May 12;6:7000. doi: 10.1038/ncomms8000. Nat Commun. 2015. PMID: 25965853 Free PMC article.
-
Nuclear receptor location analyses in mammalian genomes: from gene regulation to regulatory networks.Mol Endocrinol. 2008 Sep;22(9):1999-2011. doi: 10.1210/me.2007-0546. Epub 2008 Feb 21. Mol Endocrinol. 2008. PMID: 18292239 Free PMC article. Review.
-
Transcription factor KLF11 integrates progesterone receptor signaling and proliferation in uterine leiomyoma cells.Cancer Res. 2010 Feb 15;70(4):1722-30. doi: 10.1158/0008-5472.CAN-09-2612. Epub 2010 Feb 2. Cancer Res. 2010. PMID: 20124487 Free PMC article.
-
Estradiol regulates expression of estrogen receptor ERalpha46 in human macrophages.PLoS One. 2009;4(5):e5539. doi: 10.1371/journal.pone.0005539. Epub 2009 May 18. PLoS One. 2009. PMID: 19440537 Free PMC article.
-
Long-range transcriptional control of progesterone receptor gene expression.Mol Endocrinol. 2010 Feb;24(2):346-58. doi: 10.1210/me.2009-0429. Epub 2009 Dec 1. Mol Endocrinol. 2010. PMID: 19952285 Free PMC article.
References
-
- Bourdeau V, Deschenes J, Metivier R, Nagai Y, Nguyen D, Bretschneider N, Gannon F, White JH, Mader S. Genome-wide identification of high-affinity estrogen response elements in human and mouse. Mol. Endocrinol. 2004;18:1411–1427. - PubMed
-
- Carroll J, Meyer C, Song J, Li W, Geistlinger T, Eeckhoute J, Brodshy A, Keeton E, Fertuck K, Hall G, Wang Q, Bekiranov S, Sementchenko V, Fox E, Silver P, Gingeras T, Liu X, Brown M. Genome-wide analysis of estrogen receptor binding sites. Nat. Genet. 2006;38:1289–1297. - PubMed
-
- Carroll JS, Liu XS, Brodsky AS, Li W, Meyer CA, Szary AJ, Eeckhoute J, Shao W, Hestermann EV, Geistlinger TR, Fox EA, Silver PA, Brown M. Chromosome-wide mapping of estrogen receptor binding reveals long-range regulation requiring the forkhead protein FoxA1. Cell. 2005;122:33–43. - PubMed
-
- Colditz GA. Relationship between estrogen levels, use of hormone replacement therapy, and breast cancer. J. Natl. Cancer Inst. 1998;90:814–823. - PubMed
-
- Couse JF, Korach KS. Estrogen receptor null mice: what have we learned and where will they lead us? Endocr. Rev. 1999;20:358–417. - PubMed
Publication types
MeSH terms
Substances
Grants and funding
LinkOut - more resources
Full Text Sources

