Comparative Study
. 2007 Feb 7;26(3):846-54.
doi: 10.1038/sj.emboj.7601556. Epub 2007 Jan 25.

Novel regulation of MHC class II function in B cells

Affiliations
Comparative Study

Novel regulation of MHC class II function in B cells

Yohei Matsuki et al. EMBO J. .

Abstract

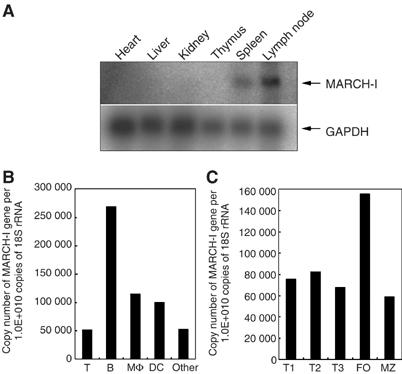
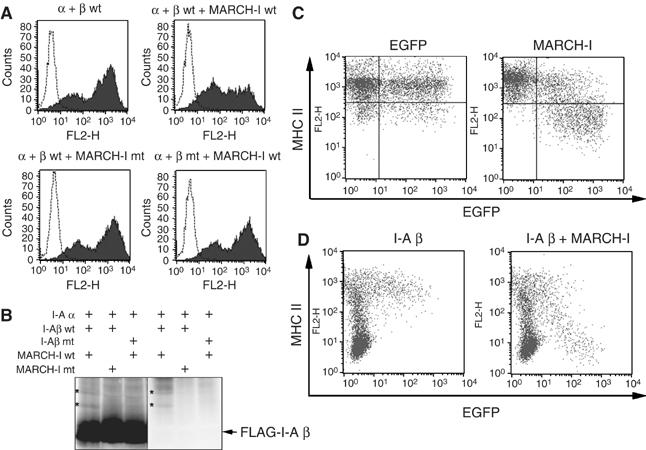
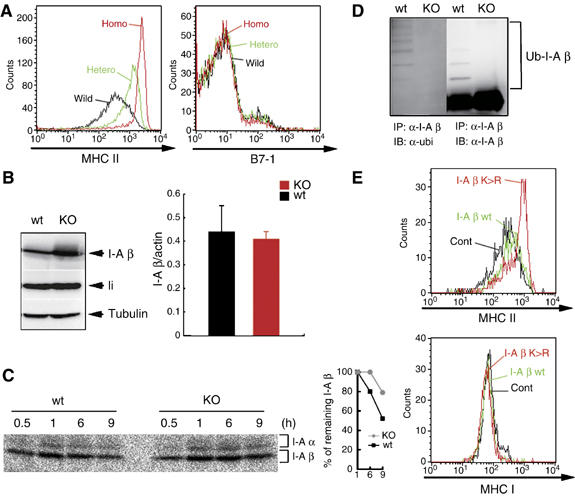
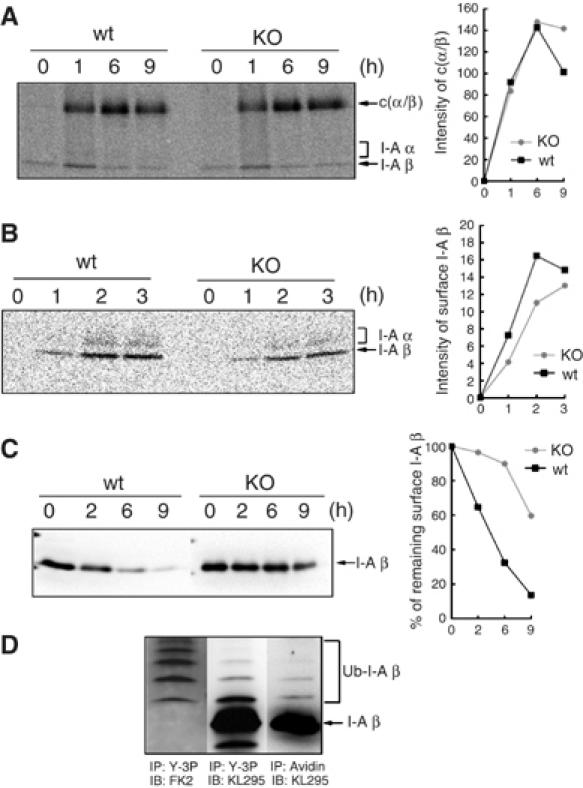
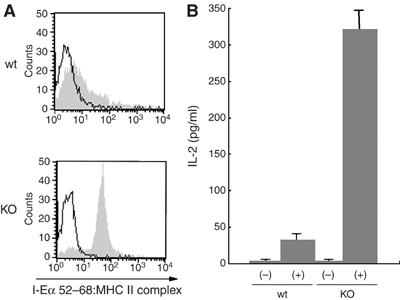
The presence of post-translational regulation of MHC class II (MHC II) under physiological conditions has been demonstrated recently in dendritic cells (DCs) that potently function as antigen-presenting cells (APCs). Here, we report that MARCH-I, an E3 ubiquitin ligase, plays a pivotal role in the post-translational regulation of MHC II in B cells. MARCH-I expression was particularly high in B cells, and the forced expression of MARCH-I induced the ubiquitination of MHC II. In B cells from MARCH-I-deficient mice (MARCH-I KO), the half-life of surface MHC II was prolonged and the ubiquitinated form of MHC II completely disappeared. In addition, MARCH-I-deficient B cells highly expressed exogenous antigen-loaded MHC II on their surface and showed high ability to present exogenous antigens. These results suggest that the function of MHC II in B cells is regulated through ubiquitination by MARCH-I.


Figures

Figure 1
Figure 1
Expression profile of MARCH-I mRNA. (A) Expression profile of MARCH-I mRNA was analyzed by Northern blot in the indicated tissues. Data are representative of two independent experiments. (B) Expression levels of MARCH-I mRNA were compared among the indicated cell fractions in splenocytes. Data are representative of two independent experiments. (C) Expression levels of MARCH-I mRNA were compared among the indicated cell fractions in splenic B cells. Data are representative of two independent experiments. FO, follicular B cells; MZ, marginal zone B cells.
Figure 2
Figure 2
Downregulation and ubiquitination of MHC II by MARCH-I. (A) 293T cells were transfected with the expression plasmid indicated above each panel, with Fugene 6 reagent (Roche). Twenty-four hours after transfection, MHC II surface expression was analyzed by FACS. Data are representative of two independent experiments. (B) As indicated above each panel, 293T cells were cotransfected with several expression plasmids, and Flag-tagged I-A β chain was precipitated with anti-Flag Ab. Precipitated samples were probed with anti-Flag Ab (left) or anti-ubiquitin Ab (right). The band corresponding to the ubiquitinated I-A β chain is marked (*) as shown. Data are representative of two independent experiments. (C) A20 cells were transfected with plasmid expressing EGFP and MARCH-I from different promoters (right). In the left panel, only EGFP protein was expressed as control. MHC II surface expression level was examined by FACS. Data are representative of two independent experiments. (D) In M12 C3 cells that express the I-A α, but not I-A β, chain, I-A β chain alone (left) or MARCH-I plus I-A β chain (right) was expressed by electroporation with EGFP-coexpressing plasmid used in (C). MHC II surface expression was examined by FACS. Data are representative of two independent experiments.
Figure 3
Figure 3
MHC II as a physiological substrate of MARCH-I. (A) MHC II (left) or B7-1 (right) surface expression was examined in blood-circulating B cells. Data from control littermates (wild), heterozygous MARCH-I KO (Hetero), and homozygous MARCH-I KO (Homo) are shown. Data are representative of two independent experiments. (B) In the left panel, I-A β chain protein or invariant chain (li) protein expression was examined in splenic B cells from respective mice. To show that the two samples have the same amount of loaded proteins, each sample was probed with anti-tubulin Ab. Data are representative of two independent experiments. Wt, control littermates; KO, homozygous MARCH-I KO. In the right panel, I-A β chain mRNA expression levels were compared between MARCH-I-deficient B cells (KO) and control B cells (Wt) by real-time PCR. Data are expressed as the mean±s.d. of triplicate samples, and values are representative of two independent experiments. (C) Splenic B cells from each mouse were pulse-labeled with [35S]methionine and [35S]cysteine for 30 min and chased for 0.5–9 h. Labeled protein samples were extracted and precipitated with Y-3P anti-I-A β chain Ab and analyzed by SDS–PAGE. At each point, the percentage of remaining I-A β chain was calculated relative to the amount of labeled I-A β chain at 1 h of chase (right panel). Data are representative of three independent experiments. (D) MHC II molecules were purified with Y-3P anti-I-A β chain Ab, and subjected to Western blot analysis with FK2 anti-ubiquitin Ab (left) or KL295 anti-I-A β chain Ab (right). Data are representative of two independent experiments. (E) Sca-1+ BM cells were infected with retrovirus that expresses the I-A β chain wild type (I-A β wt), I-A β chain mutant type (I-A β K>R), or human CD8 alone (Cont). Chimeric mice were generated with these modified BM cells. Eight weeks after reconstitution, blood-circulating B cells expressing the same level of human CD8 were analyzed in terms of MHC II expression level by FACS.
Figure 4
Figure 4
Stabilization of surface MHC II in MARCH-I-deficient B cells. (A) Splenic B cells from each mouse were pulse-labeled as shown in Figure 3C. Labeled protein samples were extracted and precipitated with Y-3P anti-I-A β chain Ab and analyzed by SDS–PAGE, without boiling the samples before electrophoresis. At each point, the intensity of SDS-stable compact dimer was measured with an image analyzer and presented far right from the panel. c(α/β) represents the SDS-stable compact dimer. Data are representative of two independent experiments. (B) Splenic B cells were pulse-labeled and chased as in (A). At the end of the chase periods indicated above the panel, each cell type was biotinylated with NHS-SS-biotin in PBS. The samples were precipitated with Y-3P anti-I-A β Ab, followed by precipitation with streptavidin–agarose. At each point, the intensity of the I-A β chain was measured with an image analyzer and presented far right from the panel. Data are representative of four independent experiments. (C) Surface MHC II molecules of splenic B cells were biotinylated and chased for 0–9 h. At each point, the amount of biotinylated MHC II was determined by Western blot analysis with KL295 anti-I-A β chain Ab, and the percentage of remaining surface I-A β was calculated relative to the value at 0 h (right panel). Data are representative of two independent experiments. (D) Surface MHC II molecules of splenic B cells from control littermates were biotinylated, purified with streptavidin–agarose, and analyzed with KL295 MHC II mAb (right panel). The same samples were incubated with Y-3P MHC II mAb and precipitated MHC II proteins were eluted with SDS buffer and analyzed with FK2 ubiquitin mAb (left panel) or KL295 MHC II mAb (middle panel). Data are representative of two independent experiments.
Figure 5
Figure 5
Internalization and recycling of MHC II in MARCH-I-deficient B cells. (A) Purified B cells were pretreated with 10 μM bafilomycin A1 (Bafilo) or DMSO at 37°C for 30 min. Surface MHC II molecules of pretreated cells were biotinylated and chased for 0–120 min. At each point, the amount of biotinylated MHC II was determined by Western blot analysis with KL295 anti-I-A β chain Ab, and the percentage of remaining surface I-A β chain was presented far right from the panel. Data are representative of two independent experiments. (B) Surface molecules of the same number of splenic B cells from MARCH-I KO or control littermates were biotinylated and incubated at 37°C for 10 or 30 min. At each point, the remaining cell-surface biotin was cleaved by reducing its disulfide linkage. Upper panel shows the total amount of biotinylated surface I-A β chains and lower panel shows the amount of internalized I-A β chains at each incubation time. At each point, the percentage of internalized MHC II was calculated relative to the total amount of biotinylated surface I-A β chains, and presented far right from the panel. Data are representative of four independent experiments. (C) Purified B cells were stained with FITC-conjugated AF6-120.1 anti-I-A β chain mAb at 4°C and washed with 2% calf serum-containing PBS. Labeled B cells were cultured in RPMI with 10% fetal calf serum in the presence of 50 nM LysoTracer Red DND-99 or 5 μg/ml Alexa 594-conjugated transferrin (Invitrogen) for 60 min at 37°C. Cells were washed in an acidic solution to remove uninternalized Abs, fixed, and subjected to examination with a LEICA DMIRE2 confocal laser scanning microscope.
Figure 6
Figure 6
Enhanced antigen presentation by MARCH-I-deficient B cells. (A) Splenic B cells from each mouse type were incubated with 10 μM I-Eα peptide 52–68 for 20 h, and surface expression of I-Eα peptide-loaded MHC II was analyzed using Y-Ae mAb. Data are representative of two independent experiments. Open and shaded histograms show the values for non-incubation and incubation with peptide, respectively. (B) Splenic B cells incubated as in (A) were fixed with 0.5% paraformaldehyde and incubated with 20.6 T-T hybridoma overnight. IL-2 production from 20.6 T-T hybridoma was determined by enzyme-linked immunosorbent assay. Data are expressed as the mean±s.e.m. of triplicate samples, and values are representative of two independent experiments. (−) and (+) indicate non-incubation and incubation with peptide, respectively.

Similar articles

Cited by

References

    1. Bartee E, Mansouri M, Hovey Nerenberg BT, Gouveia K, Fruh K (2004) Downregulation of major histocompatibility complex class I by human ubiquitin ligases related to viral immune evasion proteins. J Virol 78: 1109–1120 - PMC - PubMed
    1. Brachet V, Raposo G, Amigorena S, Mellman I (1997) Ii chain controls the transport of major histocompatibility complex class II molecules to and from lysosomes. J Cell Biol 137: 51–65 - PMC - PubMed
    1. Coscoy L, Ganem D (2000) Kaposi's sarcoma-associated herpesvirus encodes two proteins that block cell surface display of MHC class I chains by enhancing their endocytosis. Proc Natl Acad Sci USA 97: 8051–8056 - PMC - PubMed
    1. Coscoy L, Ganem D (2001) A viral protein that selectively downregulates ICAM-1 and B7-2 and modulates T cell costimulation. J Clin Invest 107: 1599–1606 - PMC - PubMed
    1. Coscoy L, Ganem D (2003) PHD domains and E3 ubiquitin ligases: viruses make the connection. Trends Cell Biol 13: 7–12 - PubMed

Publication types

MeSH terms

Substances