. 2007 Mar 10;313(5):849-66.
doi: 10.1016/j.yexcr.2006.12.005. Epub 2006 Dec 21.

Erk1/2 MAPK and caldesmon differentially regulate podosome dynamics in A7r5 vascular smooth muscle cells

Affiliations

Erk1/2 MAPK and caldesmon differentially regulate podosome dynamics in A7r5 vascular smooth muscle cells

Zhizhan Gu et al. Exp Cell Res. .

Abstract

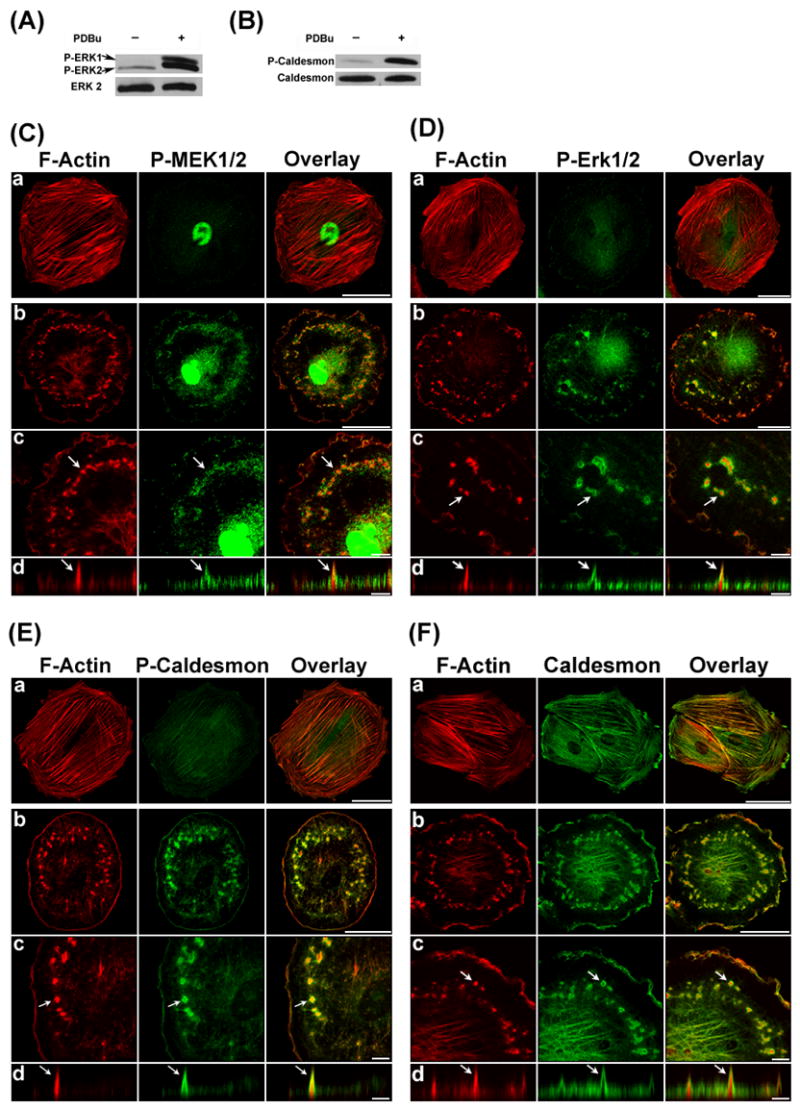
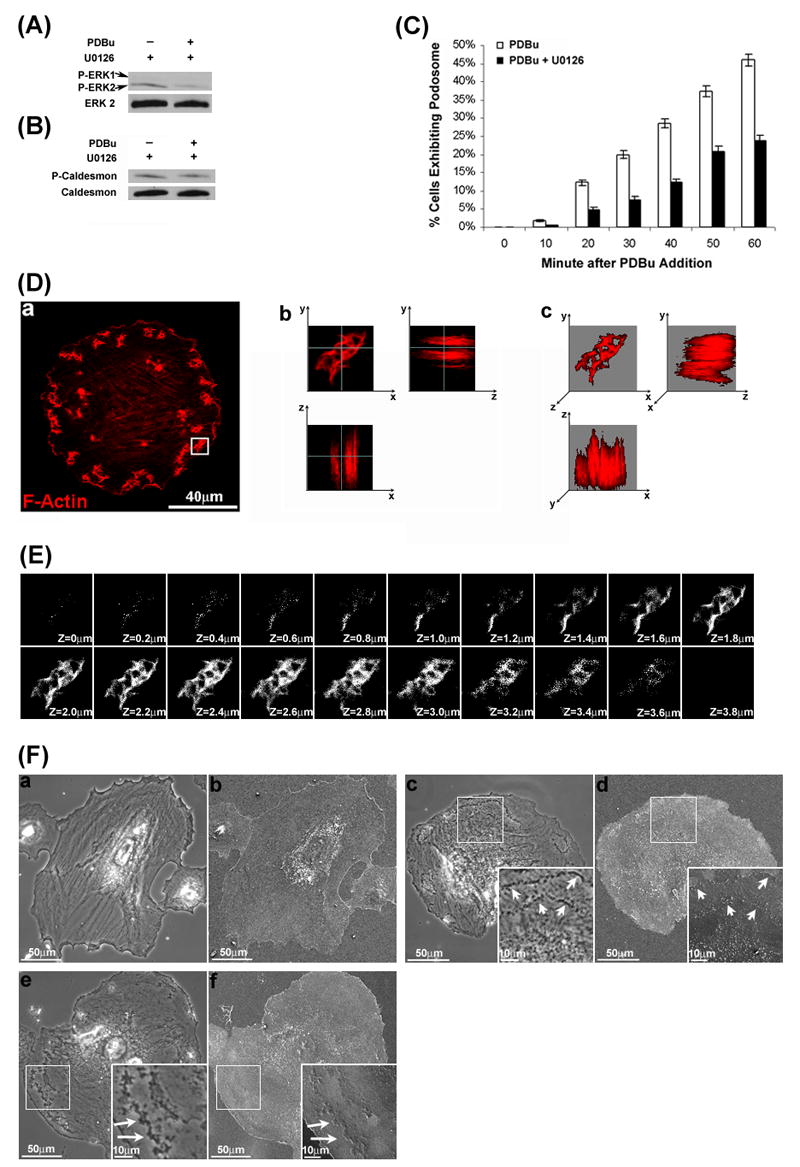
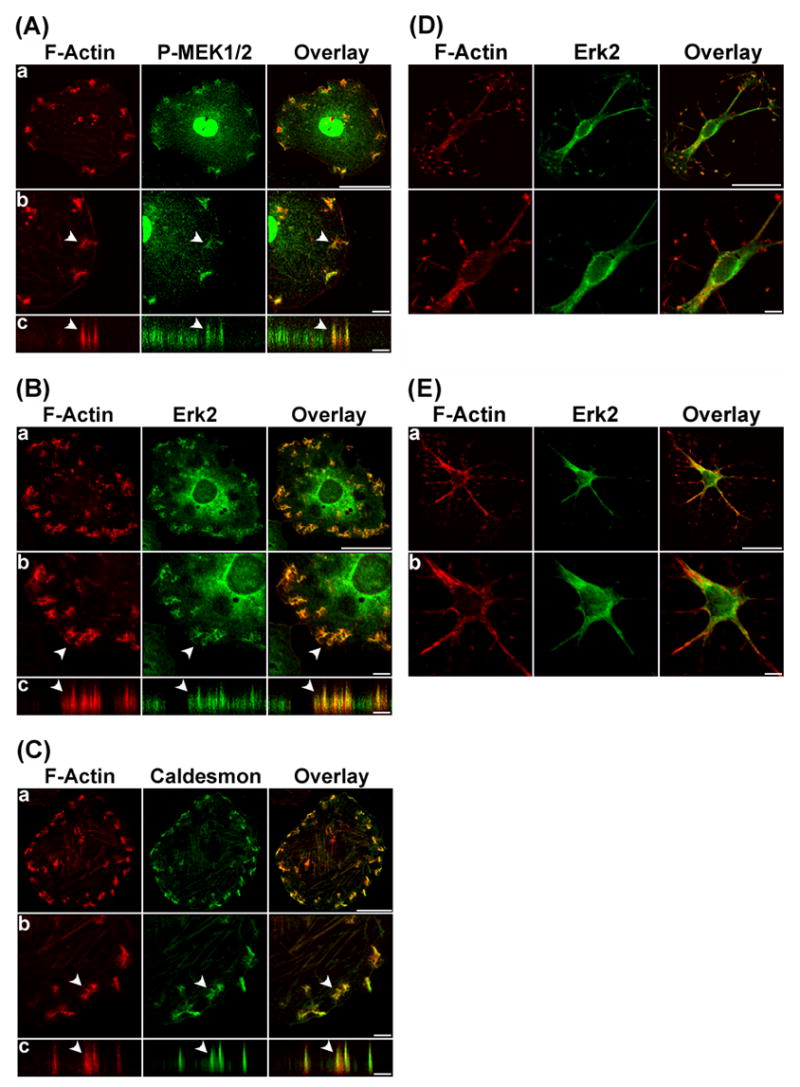
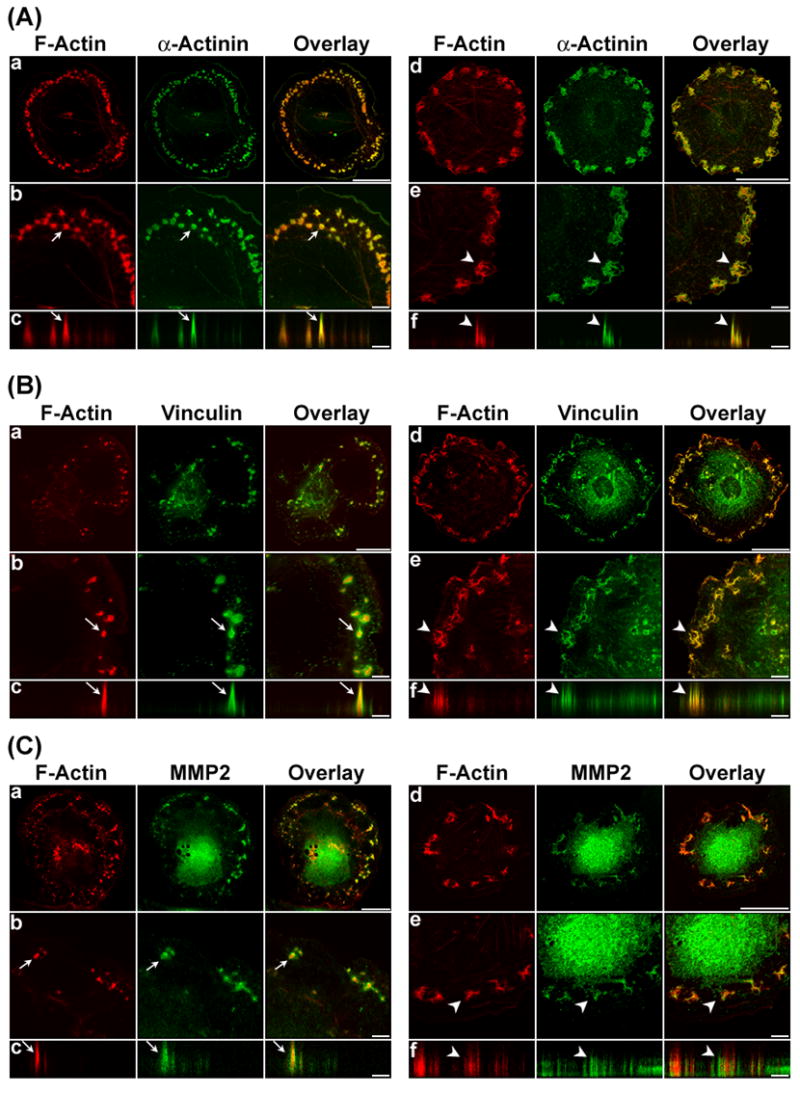
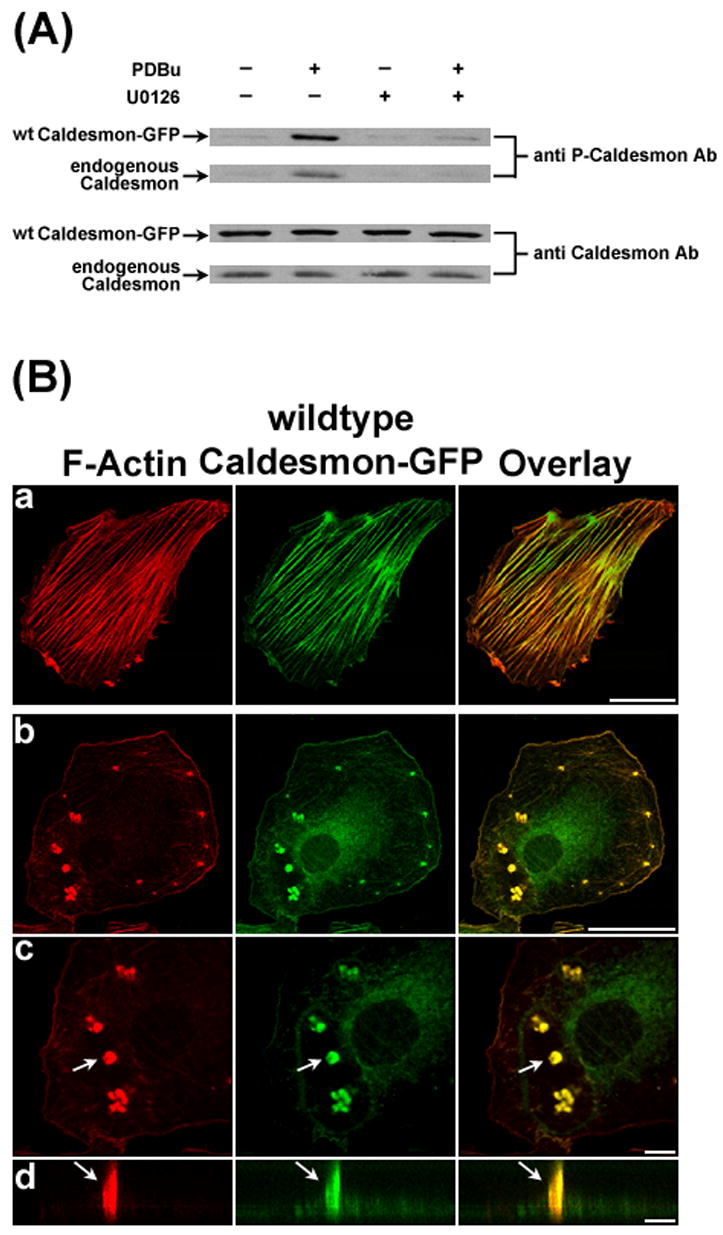
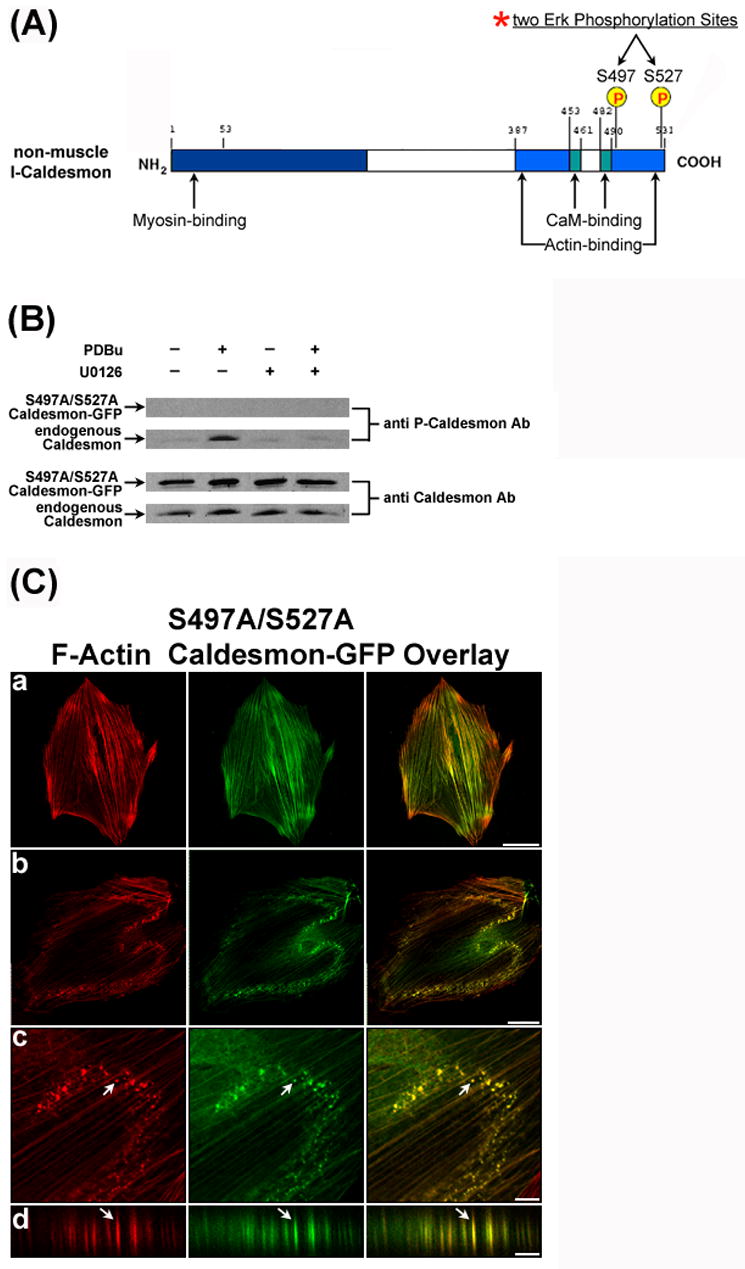
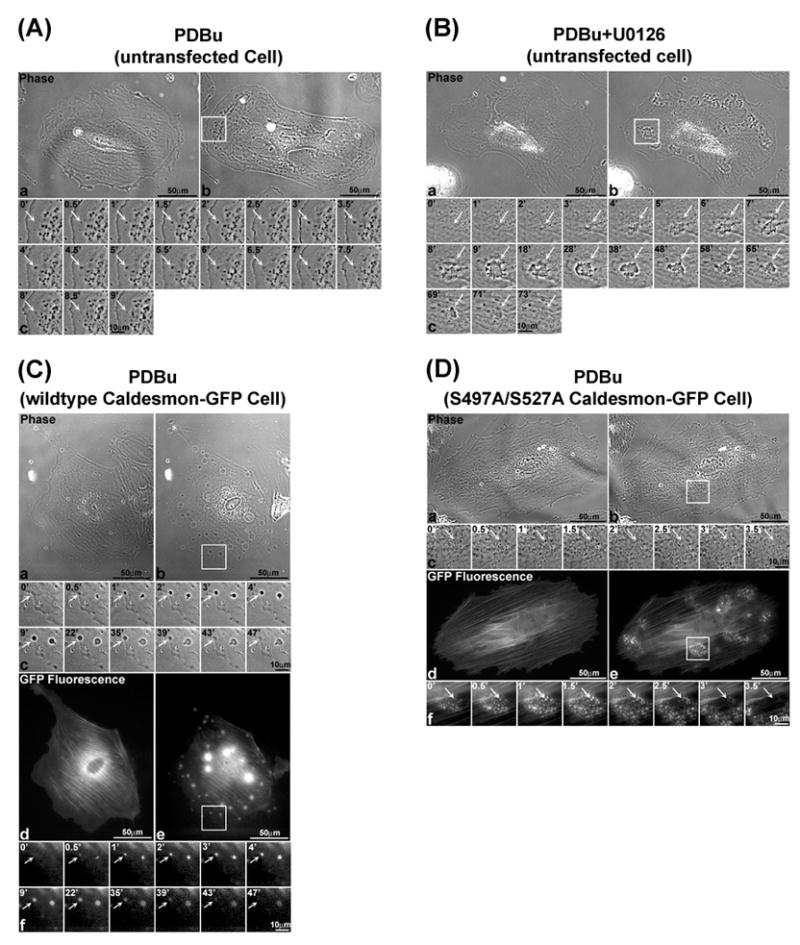
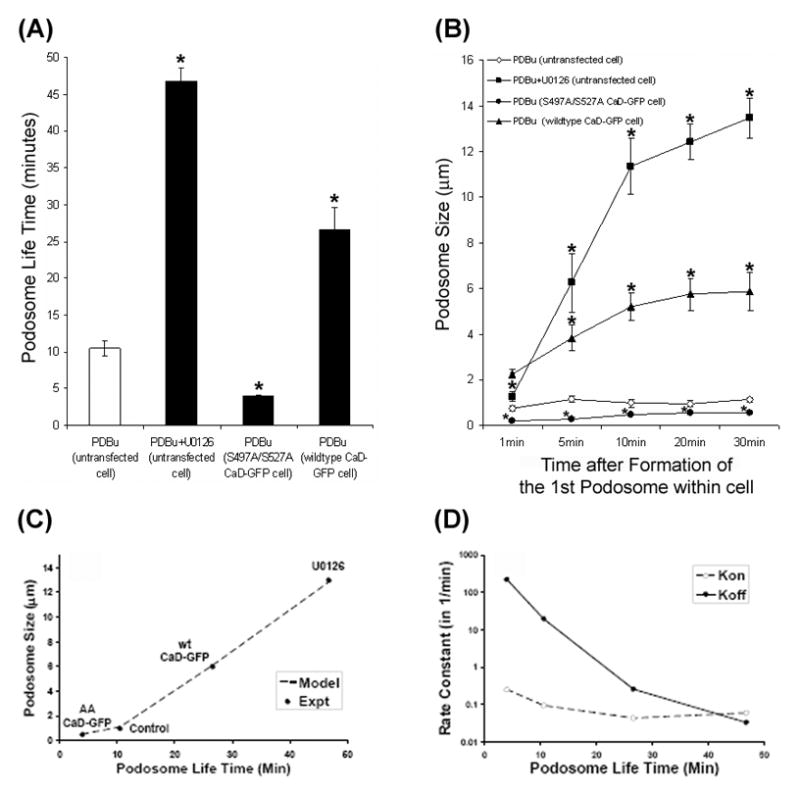
We tested the hypothesis that the MEK/Erk/caldesmon phosphorylation cascade regulates PKC-mediated podosome dynamics in A7r5 cells. We observed the phosphorylation of MEK, Erk and caldesmon, and their translocation to the podosomes upon phorbol dibutyrate (PDBu) stimulation, together with the nuclear translocation of phospho-MEK and phospho-Erk. After MEK inhibition by U0126, Erk translocated to the interconnected actin-rich columns but failed to translocate to the nucleus, suggesting that podosomes served as a site for Erk phosphorylation. The interconnected actin-rich columns in U0126-treated, PDBu-stimulated cells contained alpha-actinin, caldesmon, vinculin, and metalloproteinase-2. Caldesmon and vinculin became integrated with F-actin at the columns, in contrast to their typical location at the ring of podosomes. Live-imaging experiments suggested the growth of these columns from podosomes that were slow to disassemble. The observed modulation of podosome size and life time in A7r5 cells overexpressing wild-type and phosphorylation-deficient caldesmon-GFP mutants in comparison to untransfected cells suggests that caldesmon and caldesmon phosphorylation modulate podosome dynamics in A7r5 cells. These results suggest that Erk1/2 and caldesmon differentially modulate PKC-mediated formation and/or dynamics of podosomes in A7r5 vascular smooth muscle cells.


Figures

Figure 1
Figure 1
PDBu stimulated MEK/Erk1/2/caldesmon phosphorylation and translocation in A7r5 Cells. Panels A and B show the Western blots of Erk1/2 and caldesmon phosphorylation in unstimulated cells ( PDBu−) and PDBu-stimulated cells (PDBu+). Labeling of total Erk2 and caldesmon (bottom rows) are also included as loading controls. Panels C, D, E, and F show the confocal fluorescence microscopy of F-Actin, phospho-MEK1/2, phospho-Erk1/2, phospho-caldesmon, and total caldesmon respectively in unstimulated cells (row a) and PDBu stimulated cells (rows b to d). F-Actin was labeled in red by Alexa 568-conjugated phalloidin. Phospho-MEK1/2, phospho-Erk1/2, phospho-caldesmon, and total caldesmon were labeled in green by specific primary antibodies, followed by Alexa 488-conjugated secondary antibody. Podosomes indicated by arrows (row c) were enlarged and scanned along the orthogonal axis (row d), showing the columnar structure of podosomes having an F-actin core surrounded by phospho-MEK1/2, phospho-Erk1/2, phospho-caldesmon, and total caldesmon. Size bars represent 40 μm in rows a and b, and 8 μm in rows c and d. Z distances in row d of panels C, D, E, and F were amplified to show the podosome core and ring structure clearly. Actual podosome heights were ~3 μm in this figure.
Figure 2
Figure 2
MEK1/2 Inhibition by U0126 abolished PDBu-stimulated Erk1/2 and caldesmon phosphorylation, decreased the percentage of podosome-forming cells, and induced the formation of interconnected actin-rich columns in A7r5 cells. The Western blots in panels A and B show that U0126 abolished PDBu-stimulated phosphorylation of both Erk1/2 and caldesmon. Labeling of total Erk2 and caldesmon are also included as loading controls. Panel C shows the inhibitory effect of U0126 on the percentage of cells forming podosomes in response to PDBu stimulation. A7r5 cells were either incubated in serum-free medium or pretreated with U0126 for 1 hr before PDBu stimulation and cell counting. Cells were fixed at 0 min (unstimulated), 10, 20, 30, 40, 50, or 60 min after PDBu stimulation. Podosomes were identified by labeling the core protein, F-Actin using Alexa 568-conjugated phalloidin, and then imaged by confocal fluorescence microscopy. Cells exhibiting a minimum of three podosomes were counted as positive. Bars and vertical lines in panel C represent means ± SE (n = 200). Panel D-a shows the two-dimensional distribution of interconnected actin-rich columns in a U0126-treated, PDBu-stimulated cell. In this experiment, A7r5 cells were pretreated with U0126 for 1 hour, followed by PDBu stimulation in the presence of U0126 for another 1 hour. Podosomes were identified by labeling the core protein, F-Actin using Alexa 568-conjugated phalloidin and imaged by confocal fluorescence microscopy. Panels D-b (orthogonal view) shows the columnar structure within interconnected actin-rich columns in Y-Z and X-Z planes as imaged by confocal fluorescence microscopy with Z-sectioning. White lines denote orthogonal positions. Panel D-c shows the three-dimensional reconstruction of the same interconnected actin-rich columns by maximum intensity projections, revealing the interconnections among actin-rich columns. Panel E shows serial optical sections of the same interconnected actin-rich columns from top to bottom. The Z distance between optical sections was 0.2 μm. Panel F shows the phase-contrast (a, c, e) and scanning electron microscopic (b, d, f) images of an untreated cell (a, b), PDGF-stimulated cell (c,d), and U0126-treated, PDBu-stimulated cell (e, f). Insets in panels F-c, F-d, F-e, and F-f represent higher magnification of selected regions of a cell.
Figure 3
Figure 3
Phospho-MEK1/2, Erk2, and caldesmon were localized at the interconnected actin-rich columns in U0126-treated, PDBu-stimulated cells. In panels A, B, and C, F-Actin was labeled in red by Alexa 568-conjugated phalloidin. Phospho-MEK1/2, Erk2, and caldesmon were labeled green by specific primary antibodies, followed by Alexa 488-conjugated secondary antibody. Interconnected actin-rich columns indicated by arrows were enlarged (row b), and then scanned along the orthogonal axis (row c) to illustrate the columnar localization of these proteins within the interconnected actin-rich columns. Size bars represent 40 μm in row a, and 8 μm in rows b and c. Z distances in rows c of panels A, B, and C were amplified to show the interconnected actin-rich columns clearly. Actual column heights were ~3μm in this figure. In panel D, A7r5 cells were treated with serum-free media containing 2μM cytochalasin D for 2 hours. F-Actin was labeled in red by Alexa 568-conjugated phalloidin. Erk2 was labeled green by specific primary antibodies, followed by Alexa 488-conjugated secondary antibody. In panel E, A7r5 cells were pretreated with serum-free media containing 2μM cytochalasin D for 1 hour and then stimulated by serum-free media containing 1μM PDBu and 2μM cytochalasin D for another hour. F-Actin was labeled in red by Alexa 568-conjugated phalloidin. Erk2 was labeled green by specific primary antibodies, followed by Alexa 488-conjugated secondary antibody. Size bars represent 40 μm in row a, and 8 μm in rows b.
Figure 4
Figure 4
α-Actinin, vinculin, and MMP-2 are localized at the podosomes and interconnected actin-rich columns in U0126-treated, PDBu-stimulated A7r5 cells. Panels A to C show the localization of α-actinin, vinculin and MMP-2 at the podosomes in control cells (rows a to c), or interconnected actin-rich columns in U0126-treated cells (rows d to f) in response to PDBu stimulation. In the control group, A7r5 cells were incubated in serum-free media for 1 hr, and then stimulated by PDBu for 1 hour. In the U0126 treatment group, A7r5 cells were pretreated by U0126 for 1 hour, and then stimulated by PDBu in the presence of U0126 for 1 hour. F-Actin was labeled in red by Alexa 568-conjugated phalloidin. Other proteins were labeled green by specific primary antibodies, followed by Alexa 488-conjugated secondary antibody. Podosomes or interconnected actin-rich columns indicated by arrows were enlarged, and then scanned along the orthogonal direction to show the columnar distribution of the podosome markers. Size bars represent 40 μm in rows a and d, and 8 μm in rows b, c, e, and f. Z distances in rows c and f of panels A, B, and C were amplified to show the podosomes and interconnected actin-rich columns clearly. Actual heights of podosomes and interconnected actin-rich columns were ~ 3 μm in this figure.
Figure 5
Figure 5
Overexpression of wild-type (wt) caldesmon-GFP induced the formation of relatively few but large podosomes in response to PDBu stimulation. Panel A shows the overexpression of wt caldesmon-GFP in A7r5 cells after 72 hours of transfection. Western blot analysis using an anti-caldesmon antibody demonstrated the overexpression of wt caldesmon-GFP (3rd row) together with the expression of endogenous caldesmon (4th row) in A7r5 cells. Anti-phospho-caldesmon labeling of the same blot showed that both wild-type caldesmon-GFP and endogenous caldesmon became phosphorylated in response to PDBu stimulation, and that U0126 inhibited phosphorylation of both molecules (1st and 2nd rows). Panel B shows the labeling of F-actin by Alexa 568-conjugated phalloidin and caldesmon-GFP fluorescence in unstimulated cells (row a) and PDBu-stimulated cells (rows b to d), respectively. Podosomes indicated by arrows were enlarged (row c), and then scanned along the orthogonal direction (row d) to illustrate the columnar structure of podosomes. Size bars represent 40 μm in rows a and b; and 8 μm in rows c and d. Z distances in panel B-d were amplified. Actual heights of podosomes were ~5 μm in this figure.
Figure 6
Figure 6
Overexpression of phosphorylation-deficient caldesmon induced the formation of relatively small podosomes in response to PDBu stimulation. Panel A shows the two Erk phosphorylation sites (S497 and S527) at the C-terminal of l-caldesmon that were mutated to alanine. Panel B shows overexpression of the S497A/S527A caldesmon-GFP mutant in A7r5 cells at 72 hours after transfection. Western blot analysis using an anti-caldesmon antibody demonstrated the overexpression of (S497A/S527A) caldesmon-GFP (3rd row) and endogenous caldesmon (4th row) in A7r5 cells. Anti-phospho-caldesmon labeling of the same blot showed that only endogenous caldesmon became phosphorylated in response to PDBu stimulation, and that U0126 inhibited its phosphorylation (2nd row). There was no detectable phosphorylation of S497A/S527A caldesmon-GFP mutant by the same anti-phospho-caldesmon antibody (1st row). Panel C shows the formation of relatively small podosomes in cells overexpressing (S497A/S527A) caldesmon-GFP upon PDBu stimulation. Rows a and b show the distribution of F-actin as labeled by Alexa 568-conjugated phalloidin and (S497A/S527A) caldesmon-GFP fluorescence in unstimulated and PDBu-stimulated cells, respectively. Podosomes indicated by arrows were enlarged (row c), and then scanned along the orthogonal direction (row d) to illustrate the columnar structure of podosomes. Size bars represent 40 μm in rows a and b; and 8 μm in rows c and d. Z distances in row d were amplified. Actual heights of podosomes were ~2 μm in panel C.
Figure 7
Figure 7
Erk1/2 and caldesmon differentially regulated the spatiotemporal dynamics of podosomes in live A7r5 cells during PDBu stimulation. Panel A shows the podosome dynamics in an untransfected cell during PDBu-stimulation as recorded by phase-contrast live-imaging. Panels A-a and A-b show the live images of a cell before and after PDBu stimulation. Panel A-c shows a podosome in this cell as indicated by an arrow from its first appearance to its disappearance over 9 min (B-c). Panel B shows the formation of interconnected actin-rich columns in an U0126-treated cell during PDBu stimulation as recorded by phase-contrast live-imaging. Panels B-a and B-b show the live images of an U0126-treated cell before and after PDBu stimulation. Panel A-c shows a group of interconnected actin-rich columns in this cell as indicated by an arrow from its first appearance to its disappearance over 73 min. Panel C shows podosome dynamics in a cell overexpressing wild-type caldesmon-GFP during PDBu stimulation. Panels C-a and C-d show the phase-contrast and GFP-fluorescence images of this cell before PDBu stimulation, respectively. Panels C-b and C-e show the phase-contrast and GFP-fluorescence images of this cell after PDBu stimulation, respectively. Panels C-c and C-f show the phase-contrast and GFP-fluorescence images of a podosome in this cell as indicated by an arrow from its first appearance to its disappearance over 47 min. Panel D shows podosome dynamics in a cell overexpressing the (S497A/S527A) caldesmon-GFP during PDBu stimulation. Panels D-a and D-d show the phase-contrast and GFP-fluorescence images of this cell before PDBu stimulation. Panels D-b and D-e show the phase-contrast and GFP-fluorescence images of this cell after PDBu stimulation, respectively. Panels D-c and D-f show the phase-contrast and GFP-fluorescence images of a podosome in this cell as indicated by an arrow from its first appearance to its disappearance over 3.5 min.
Figure 8
Figure 8
Modulation of podosome life time and podosome size in live A7r5 cells. Panel A shows the life times of podosomes or interconnected actin-rich columns in untransfected, untreated cells, U0126-treated cells, cells overexpressing (S497A/S527A) caldesmon-GFP, and cells overexpressing wild-type caldesmon-GFP as estimated from frame-by-frame analysis of the time-lapse images shown in Fig. 7 and Movies 1 to 6. Bars and vertical lines represent mean ± standard error (n = 30). Panel B shows the size of podosomes or interconnected actin-rich columns in the four groups of cells at 1, 5, 10, 20, and 30 min after the beginning of podosome formation as estimated from frame-by-frame analysis of time-lapse images. Symbols and vertical lines represent mean ± standard errors (n = 10). Asterisks indicate significant difference from untransfected cells (p < 0.05). Panel C shows the correlation between podosome size and podosome life time as measured in the experiments (symbols) and predicted by the minimal model of podosome dynamics (broken line). Panel D shows changes in the rate constants for podosome assembly (kon, open symbols), and podosome disassembly (koff, closed symbols) that were necessary for modeling the experimental data shown in panel C.

Similar articles

Cited by

References

    1. Newby AC. Dual role of matrix metalloproteinases (Matrixins) in intimal thickening and atherosclerotic plaque rupture. Physiol Rev. 2005;85:1–31. - PubMed
    1. Buccione R, Orth JD, McNiven MA. Foot and mouth: podosomes, invadopodia and circular dorsal ruffles. Nat Rev Mol Cell Biol. 2004;5:647–657. - PubMed
    1. Burgstaller G, Gimona M. Podosome-mediated matrix resorption and cell motility in vascular smooth muscle cells. Am J Physiol Heart Circ Physiol. 2005;288:3001–3005. - PubMed
    1. Hai CM, Hahne P, Harrington EO, Gimona M. Conventional protein kinase C mediates phorbol-dibutyrate-induced cytoskeletal remodeling in A7r5 smooth muscle cells. Exp Cell Res. 2002;280:64–74. - PubMed
    1. Linder S, Kopp P. Podosomes at a glance. J Cell Sc. 2005;118:2079–2082. - PubMed

Publication types

MeSH terms