

Using evoked potentials to match interaural electrode pairs with bilateral cochlear implants
- PMID: 17225976
- PMCID: PMC1907379
- DOI: 10.1007/s10162-006-0069-0
Using evoked potentials to match interaural electrode pairs with bilateral cochlear implants
Abstract
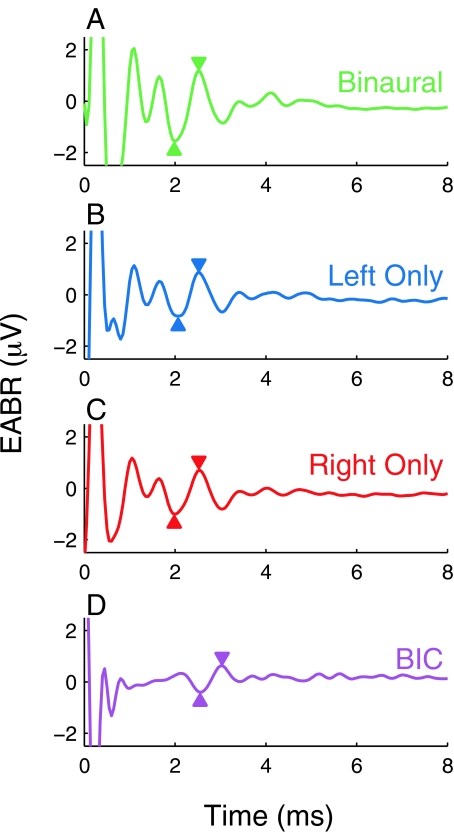
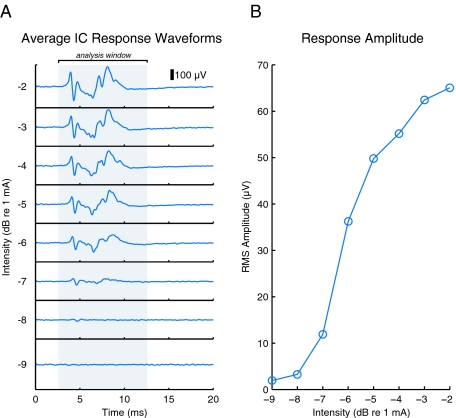
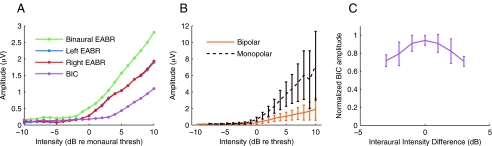
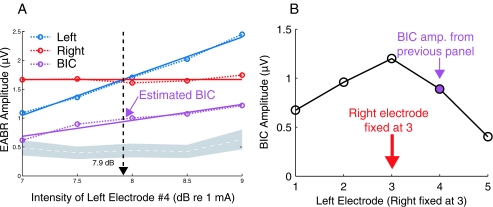
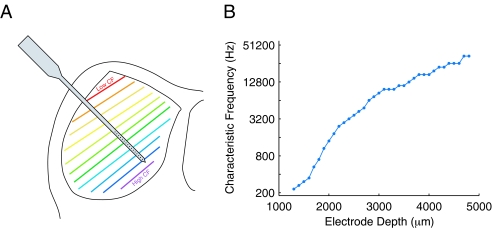
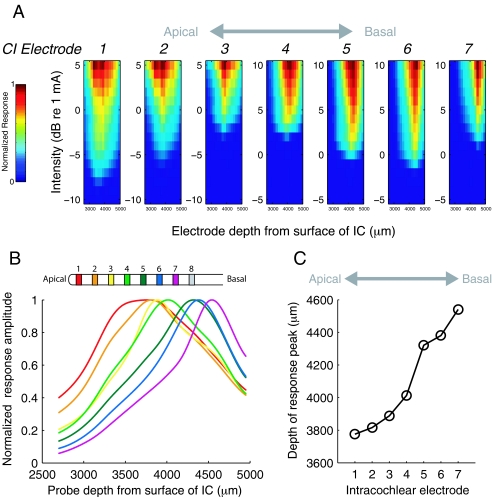
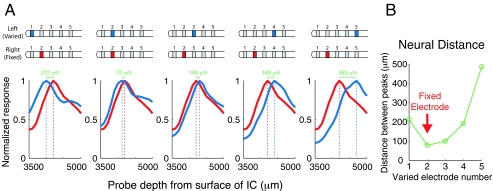
Bilateral cochlear implantation seeks to restore the advantages of binaural hearing to the profoundly deaf by providing binaural cues normally important for accurate sound localization and speech reception in noise. Psychophysical observations suggest that a key issue for the implementation of a successful binaural prosthesis is the ability to match the cochlear positions of stimulation channels in each ear. We used a cat model of bilateral cochlear implants with eight-electrode arrays implanted in each cochlea to develop and test a noninvasive method based on evoked potentials for matching interaural electrodes. The arrays allowed the cochlear location of stimulation to be independently varied in each ear. The binaural interaction component (BIC) of the electrically evoked auditory brainstem response (EABR) was used as an assay of binaural processing. BIC amplitude peaked for interaural electrode pairs at the same relative cochlear position and dropped with increasing cochlear separation in either direction. To test the hypothesis that BIC amplitude peaks when electrodes from the two sides activate maximally overlapping neural populations, we measured multiunit neural activity along the tonotopic gradient of the inferior colliculus (IC) with 16-channel recording probes and determined the spatial pattern of IC activation for each stimulating electrode. We found that the interaural electrode pairings that produced the best aligned IC activation patterns were also those that yielded maximum BIC amplitude. These results suggest that EABR measurements may provide a method for assigning frequency-channel mappings in bilateral implant recipients, such as pediatric patients, for which psychophysical measures of pitch ranking or binaural fusion are unavailable.
Figures


Similar articles
-
Comparison of Interaural Electrode Pairing Methods for Bilateral Cochlear Implants.Trends Hear. 2015 Dec 1;19:2331216515617143. doi: 10.1177/2331216515617143. Trends Hear. 2015. PMID: 26631108 Free PMC article.
-
Suitability of the Binaural Interaction Component for Interaural Electrode Pairing of Bilateral Cochlear Implants.Adv Exp Med Biol. 2016;894:57-64. doi: 10.1007/978-3-319-25474-6_7. Adv Exp Med Biol. 2016. PMID: 27080646
-
Effects of stimulation level and electrode pairing on the binaural interaction component of the electrically evoked auditory brain stem response.Ear Hear. 2010 Aug;31(4):457-70. doi: 10.1097/AUD.0b013e3181d5d9bf. Ear Hear. 2010. PMID: 20418771 Free PMC article.
-
What is the optimal timing for bilateral cochlear implantation in children?Cochlear Implants Int. 2011 Aug;12 Suppl 2:S8-14. doi: 10.1179/146701011X13074645127199. Cochlear Implants Int. 2011. PMID: 21917210 Review.
-
Perception and coding of interaural time differences with bilateral cochlear implants.Hear Res. 2015 Apr;322:138-50. doi: 10.1016/j.heares.2014.10.004. Epub 2014 Oct 19. Hear Res. 2015. PMID: 25456088 Review.
Cited by
-
Normative Study of the Binaural Interaction Component of the Human Auditory Brainstem Response as a Function of Interaural Time Differences.Ear Hear. 2021 May/Jun;42(3):629-643. doi: 10.1097/AUD.0000000000000964. Ear Hear. 2021. PMID: 33141776 Free PMC article.
-
Between-ear sound frequency disparity modulates a brain stem biomarker of binaural hearing.J Neurophysiol. 2019 Sep 1;122(3):1110-1122. doi: 10.1152/jn.00057.2019. Epub 2019 Jul 17. J Neurophysiol. 2019. PMID: 31314646 Free PMC article.
-
Corrective binaural processing for bilateral cochlear implant patients.PLoS One. 2018 Jan 19;13(1):e0187965. doi: 10.1371/journal.pone.0187965. eCollection 2018. PLoS One. 2018. PMID: 29351279 Free PMC article.
-
Envelope enhancement increases cortical sensitivity to interaural envelope delays with acoustic and electric hearing.PLoS One. 2014 Aug 5;9(8):e104097. doi: 10.1371/journal.pone.0104097. eCollection 2014. PLoS One. 2014. PMID: 25093417 Free PMC article.
-
Self-Selection of Frequency Tables with Bilateral Mismatches in an Acoustic Simulation of a Cochlear Implant.J Am Acad Audiol. 2017 May;28(5):385-394. doi: 10.3766/jaaa.15077. J Am Acad Audiol. 2017. PMID: 28534729 Free PMC article.
References
-
- {'text': '', 'ref_index': 1, 'ids': [{'type': 'DOI', 'value': '10.1121/1.1558357', 'is_inner': False, 'url': 'https://doi.org/10.1121/1.1558357'}, {'type': 'PubMed', 'value': '12703717', 'is_inner': True, 'url': 'https://pubmed.ncbi.nlm.nih.gov/12703717/'}]}
- Baskent D, Shannon RV. Speech recognition under conditions of frequency–place compression and expansion. J. Acoust. Soc. Am. 113:2064–2076, 2003. - PubMed
-
- {'text': '', 'ref_index': 1, 'ids': [{'type': 'DOI', 'value': '10.1121/1.1804627', 'is_inner': False, 'url': 'https://doi.org/10.1121/1.1804627'}, {'type': 'PubMed', 'value': '15603158', 'is_inner': True, 'url': 'https://pubmed.ncbi.nlm.nih.gov/15603158/'}]}
- Baskent D, Shannon RV. Frequency–place compression and expansion in cochlear implant listeners. J. Acoust. Soc. Am. 116:3130–3140, 2004. - PubMed
-
- {'text': '', 'ref_index': 1, 'ids': [{'type': 'PubMed', 'value': '11784764', 'is_inner': True, 'url': 'https://pubmed.ncbi.nlm.nih.gov/11784764/'}]}
- Bierer JA, Middlebrooks JC. Auditory cortical images of cochlear-implant stimuli: dependence on electrode configuration. J. Neurophysiol. 87:478–492, 2002. - PubMed
-
- {'text': '', 'ref_index': 1, 'ids': [{'type': 'DOI', 'value': '10.1121/1.383966', 'is_inner': False, 'url': 'https://doi.org/10.1121/1.383966'}, {'type': 'PubMed', 'value': '6892642', 'is_inner': True, 'url': 'https://pubmed.ncbi.nlm.nih.gov/6892642/'}]}
- Black RC, Clark GM. Differential electrical excitation of the auditory nerve. J. Acoust. Soc. Am. 67:868–874, 1980. - PubMed
-
- None
- Blauert J. Spatial Hearing: The Psychophysics of Human Sound Localization, Revised Edition. Cambridge, Mass., MIT Press, 1997.
Publication types
MeSH terms
Grants and funding
LinkOut - more resources
Full Text Sources
Medical
Miscellaneous
