

The crystal structure of the Escherichia coli AmtB-GlnK complex reveals how GlnK regulates the ammonia channel
- PMID: 17220269
- PMCID: PMC1783118
- DOI: 10.1073/pnas.0610348104
The crystal structure of the Escherichia coli AmtB-GlnK complex reveals how GlnK regulates the ammonia channel
Abstract
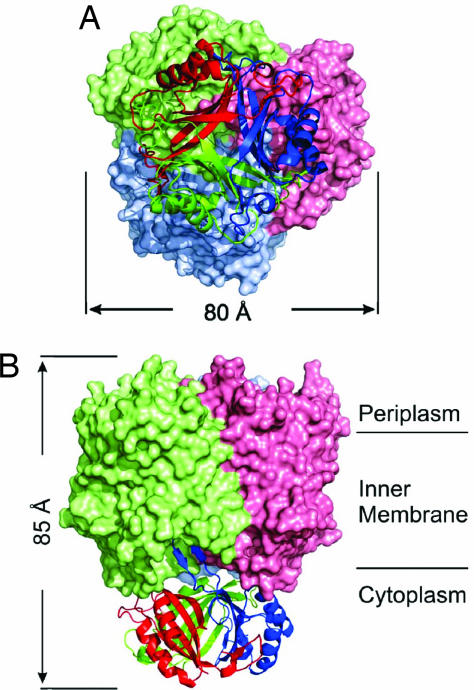
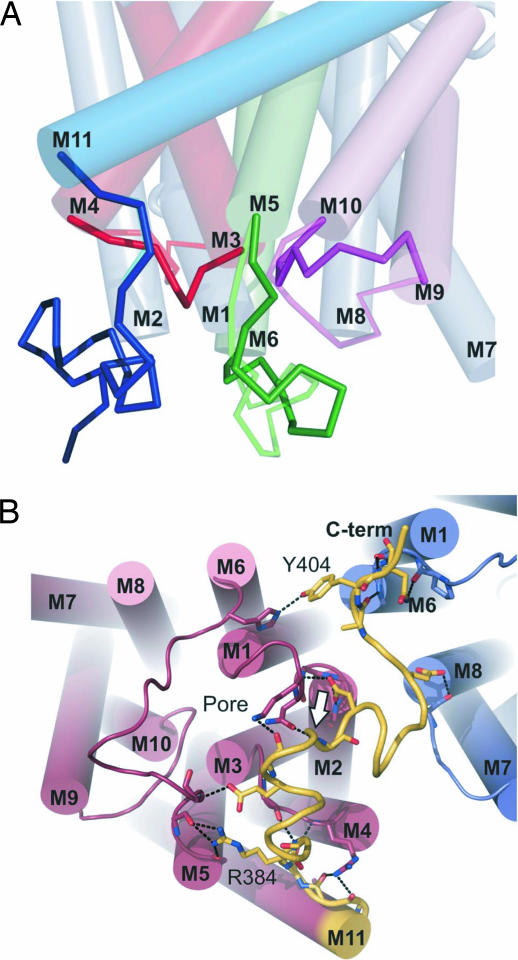
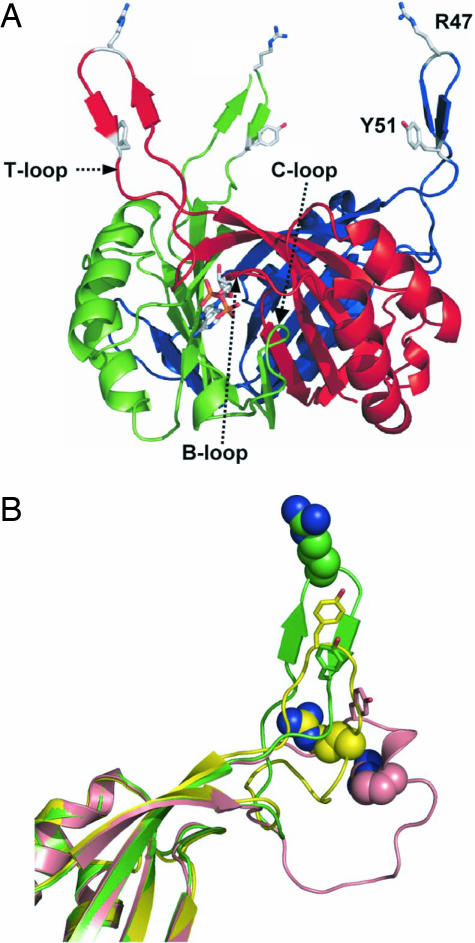
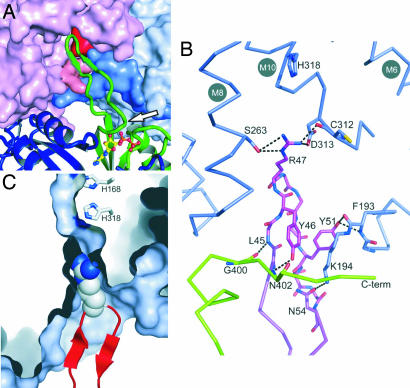
Amt proteins are ubiquitous channels for the conduction of ammonia in archaea, eubacteria, fungi, and plants. In Escherichia coli, previous studies have indicated that binding of the PII signal transduction protein GlnK to the ammonia channel AmtB regulates the channel thereby controlling ammonium influx in response to the intracellular nitrogen status. Here, we describe the crystal structure of the complex between AmtB and GlnK at a resolution of 2.5 A. This structure of PII in a complex with one of its targets reveals physiologically relevant conformations of both AmtB and GlnK. GlnK interacts with AmtB almost exclusively via a long surface loop containing Y51 (T-loop), the tip of which inserts deeply into the cytoplasmic pore exit, blocking ammonia conduction. Y51 of GlnK is also buried in the pore exit, explaining why uridylylation of this residue prevents complex formation.
Conflict of interest statement
The authors declare no conflict of interest.
Figures
Similar articles
-
Inhibitory complex of the transmembrane ammonia channel, AmtB, and the cytosolic regulatory protein, GlnK, at 1.96 A.Proc Natl Acad Sci U S A. 2007 Jan 2;104(1):42-7. doi: 10.1073/pnas.0609796104. Epub 2006 Dec 26. Proc Natl Acad Sci U S A. 2007. PMID: 17190799 Free PMC article.
-
Modulation of the protein environment in the hydrophilic pore of the ammonia transporter protein AmtB upon GlnK protein binding.FEBS Lett. 2007 Sep 4;581(22):4293-7. doi: 10.1016/j.febslet.2007.07.085. Epub 2007 Aug 14. FEBS Lett. 2007. PMID: 17707821
-
In vitro analysis of the Escherichia coli AmtB-GlnK complex reveals a stoichiometric interaction and sensitivity to ATP and 2-oxoglutarate.J Biol Chem. 2006 Oct 6;281(40):29558-67. doi: 10.1074/jbc.M602477200. Epub 2006 Jul 24. J Biol Chem. 2006. PMID: 16864585
-
Structural and functional insights into the AmtB/Mep/Rh protein family.Transfus Clin Biol. 2006 Mar-Apr;13(1-2):65-9. doi: 10.1016/j.tracli.2006.02.014. Epub 2006 Mar 24. Transfus Clin Biol. 2006. PMID: 16564194 Review.
-
Nitrogen regulation in bacteria and archaea.Annu Rev Microbiol. 2007;61:349-77. doi: 10.1146/annurev.micro.61.080706.093409. Annu Rev Microbiol. 2007. PMID: 17506680 Review.
Cited by
-
Molecular basis for the recognition of cyclic-di-AMP by PstA, a PII-like signal transduction protein.Microbiologyopen. 2015 Jun;4(3):361-74. doi: 10.1002/mbo3.243. Epub 2015 Feb 18. Microbiologyopen. 2015. PMID: 25693966 Free PMC article.
-
The W148L substitution in the Escherichia coli ammonium channel AmtB increases flux and indicates that the substrate is an ion.Proc Natl Acad Sci U S A. 2007 Nov 20;104(47):18706-11. doi: 10.1073/pnas.0709267104. Epub 2007 Nov 12. Proc Natl Acad Sci U S A. 2007. PMID: 17998534 Free PMC article.
-
The 1.3-A resolution structure of Nitrosomonas europaea Rh50 and mechanistic implications for NH3 transport by Rhesus family proteins.Proc Natl Acad Sci U S A. 2007 Dec 4;104(49):19303-8. doi: 10.1073/pnas.0706563104. Epub 2007 Nov 21. Proc Natl Acad Sci U S A. 2007. PMID: 18032606 Free PMC article.
-
Epistatic effects of the protease/chaperone HflB on some damaged forms of the Escherichia coli ammonium channel AmtB.Genetics. 2009 Dec;183(4):1327-40. doi: 10.1534/genetics.109.103747. Epub 2009 Jul 13. Genetics. 2009. PMID: 19596908 Free PMC article.
-
Crystal structure of the GlnZ-DraG complex reveals a different form of PII-target interaction.Proc Natl Acad Sci U S A. 2011 Nov 22;108(47):18972-6. doi: 10.1073/pnas.1108038108. Epub 2011 Nov 9. Proc Natl Acad Sci U S A. 2011. PMID: 22074780 Free PMC article.
References
Publication types
MeSH terms
Substances
Associated data
- Actions
LinkOut - more resources
Full Text Sources
Molecular Biology Databases
