

Large-scale mapping and validation of Escherichia coli transcriptional regulation from a compendium of expression profiles
- PMID: 17214507
- PMCID: PMC1764438
- DOI: 10.1371/journal.pbio.0050008
Large-scale mapping and validation of Escherichia coli transcriptional regulation from a compendium of expression profiles
Abstract
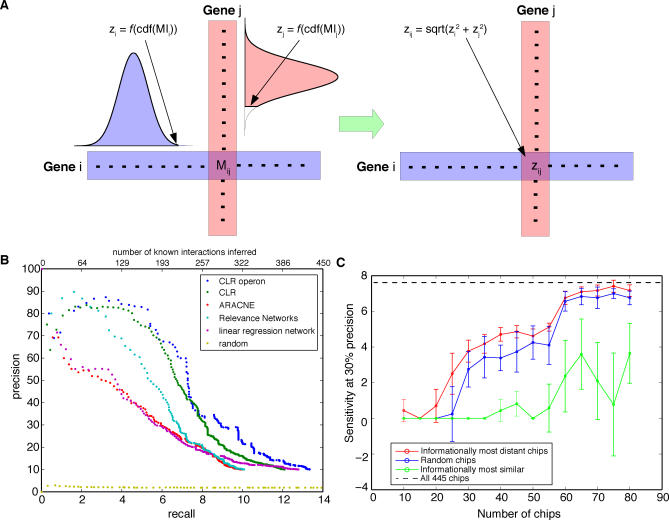
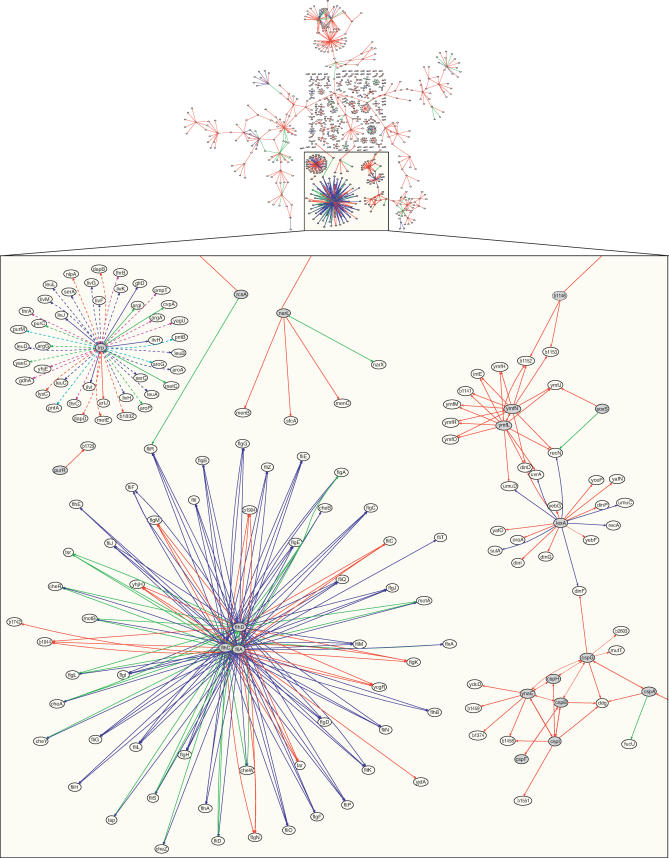
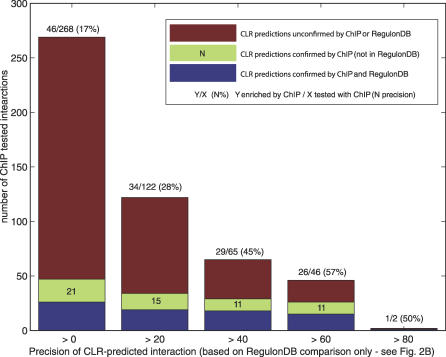
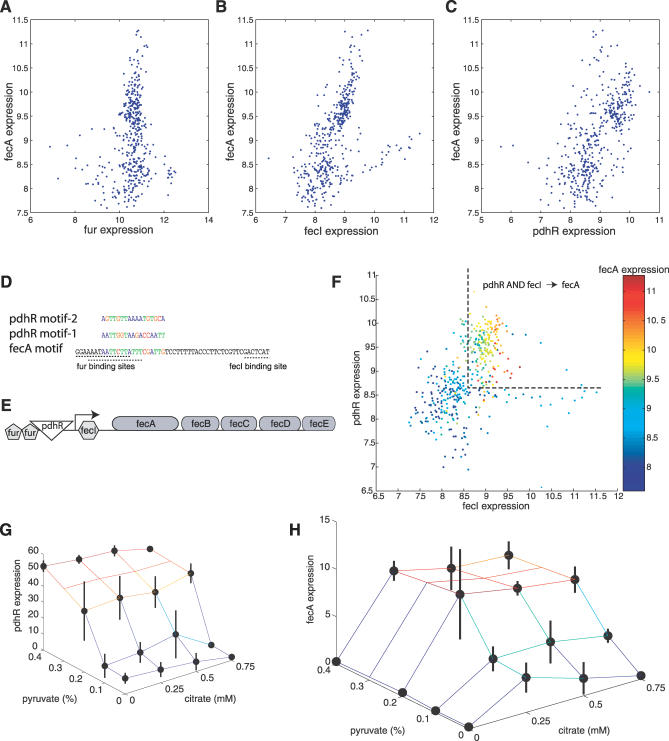
Machine learning approaches offer the potential to systematically identify transcriptional regulatory interactions from a compendium of microarray expression profiles. However, experimental validation of the performance of these methods at the genome scale has remained elusive. Here we assess the global performance of four existing classes of inference algorithms using 445 Escherichia coli Affymetrix arrays and 3,216 known E. coli regulatory interactions from RegulonDB. We also developed and applied the context likelihood of relatedness (CLR) algorithm, a novel extension of the relevance networks class of algorithms. CLR demonstrates an average precision gain of 36% relative to the next-best performing algorithm. At a 60% true positive rate, CLR identifies 1,079 regulatory interactions, of which 338 were in the previously known network and 741 were novel predictions. We tested the predicted interactions for three transcription factors with chromatin immunoprecipitation, confirming 21 novel interactions and verifying our RegulonDB-based performance estimates. CLR also identified a regulatory link providing central metabolic control of iron transport, which we confirmed with real-time quantitative PCR. The compendium of expression data compiled in this study, coupled with RegulonDB, provides a valuable model system for further improvement of network inference algorithms using experimental data.
Conflict of interest statement
Competing interests. A portion of this work was conducted in collaboration with Cellicon Biotechnologies. JJC and TSG are founders and shareholders in the company. GC and JW are also shareholders in the company. All data, results, and algorithms from this collaboration have been made publicly available.
Figures

Similar articles
-
Inference of regulatory gene interactions from expression data using three-way mutual information.Ann N Y Acad Sci. 2009 Mar;1158:302-13. doi: 10.1111/j.1749-6632.2008.03757.x. Ann N Y Acad Sci. 2009. PMID: 19348651
-
Inferring large-scale gene regulatory networks using a low-order constraint-based algorithm.Mol Biosyst. 2010 Jun;6(6):988-98. doi: 10.1039/b917571g. Epub 2010 Feb 19. Mol Biosyst. 2010. PMID: 20485743
-
Network inference algorithms elucidate Nrf2 regulation of mouse lung oxidative stress.PLoS Comput Biol. 2008 Aug 29;4(8):e1000166. doi: 10.1371/journal.pcbi.1000166. PLoS Comput Biol. 2008. PMID: 18769717 Free PMC article.
-
The condition-dependent transcriptional network in Escherichia coli.Ann N Y Acad Sci. 2009 Mar;1158:29-35. doi: 10.1111/j.1749-6632.2008.03746.x. Ann N Y Acad Sci. 2009. PMID: 19348629
-
Gene expression profiling and the use of genome-scale in silico models of Escherichia coli for analysis: providing context for content.J Bacteriol. 2009 Jun;191(11):3437-44. doi: 10.1128/JB.00034-09. Epub 2009 Apr 10. J Bacteriol. 2009. PMID: 19363119 Free PMC article. Review. No abstract available.
Cited by
-
Identification of protein complexes and functional modules in E. coli PPI networks.BMC Microbiol. 2020 Aug 6;20(1):243. doi: 10.1186/s12866-020-01904-6. BMC Microbiol. 2020. PMID: 32762711 Free PMC article.
-
Passing messages between biological networks to refine predicted interactions.PLoS One. 2013 May 31;8(5):e64832. doi: 10.1371/journal.pone.0064832. Print 2013. PLoS One. 2013. PMID: 23741402 Free PMC article.
-
Network-Based Integration of GWAS and Gene Expression Identifies a HOX-Centric Network Associated with Serous Ovarian Cancer Risk.Cancer Epidemiol Biomarkers Prev. 2015 Oct;24(10):1574-84. doi: 10.1158/1055-9965.EPI-14-1270. Epub 2015 Jul 24. Cancer Epidemiol Biomarkers Prev. 2015. PMID: 26209509 Free PMC article. Review.
-
An approach of gene regulatory network construction using mixed entropy optimizing context-related likelihood mutual information.Bioinformatics. 2023 Jan 1;39(1):btac717. doi: 10.1093/bioinformatics/btac717. Bioinformatics. 2023. PMID: 36342190 Free PMC article.
-
RefNetBuilder: a platform for construction of integrated reference gene regulatory networks from expressed sequence tags.BMC Bioinformatics. 2011 Oct 18;12 Suppl 10(Suppl 10):S20. doi: 10.1186/1471-2105-12-S10-S20. BMC Bioinformatics. 2011. PMID: 22166047 Free PMC article.
References
-
- Aderem A. Systems biology: Its practice and challenges. Cell. 2005;121:511–513. - PubMed
-
- Basso K, Margolin AA, Stolovitzky G, Klein U, Dalla-Favera R, et al. Reverse engineering of regulatory networks in human B cells. Nat Genet. 2005;37:382–390. - PubMed
-
- Beer MA, Tavazoie S. Predicting gene expression from sequence. Cell. 2004;117:185–198. - PubMed
-
- de la Fuente A, Brazhnik P, Mendes P. Linking the genes: Inferring quantitative gene networks from microarray data. Trends Genet. 2002;18:395–398. - PubMed
Publication types
MeSH terms
Substances
Grants and funding
LinkOut - more resources
Full Text Sources
Other Literature Sources
Molecular Biology Databases
