Common genetic variants account for differences in gene expression among ethnic groups
- PMID: 17206142
- PMCID: PMC3005333
- DOI: 10.1038/ng1955
Common genetic variants account for differences in gene expression among ethnic groups
Abstract
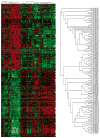
Variation in DNA sequence contributes to individual differences in quantitative traits, but in humans the specific sequence variants are known for very few traits. We characterized variation in gene expression in cells from individuals belonging to three major population groups. This quantitative phenotype differs significantly between European-derived and Asian-derived populations for 1,097 of 4,197 genes tested. For the phenotypes with the strongest evidence of cis determinants, most of the variation is due to allele frequency differences at cis-linked regulators. The results show that specific genetic variation among populations contributes appreciably to differences in gene expression phenotypes. Populations differ in prevalence of many complex genetic diseases, such as diabetes and cardiovascular disease. As some of these are probably influenced by the level of gene expression, our results suggest that allele frequency differences at regulatory polymorphisms also account for some population differences in prevalence of complex diseases.
Conflict of interest statement
The authors declare that they have no competing financial interests.
Figures


Comment in
-
On the design and analysis of gene expression studies in human populations.Nat Genet. 2007 Jul;39(7):807-8; author reply 808-9. doi: 10.1038/ng0707-807. Nat Genet. 2007. PMID: 17597765 No abstract available.
Similar articles
-
Interleukin-8 genetic diversity, haplotype structure and production differ in two ethnically distinct South African populations.Cytokine. 2021 Jul;143:155489. doi: 10.1016/j.cyto.2021.155489. Epub 2021 Apr 1. Cytokine. 2021. PMID: 33814271
-
Type 2 diabetes mellitus: distribution of genetic markers in Kazakh population.Clin Interv Aging. 2018 Mar 5;13:377-388. doi: 10.2147/CIA.S156044. eCollection 2018. Clin Interv Aging. 2018. PMID: 29551892 Free PMC article.
-
Genetic architectures of ADME genes in five Eurasian admixed populations and implications for drug safety and efficacy.J Med Genet. 2014 Sep;51(9):614-22. doi: 10.1136/jmedgenet-2014-102530. Epub 2014 Jul 29. J Med Genet. 2014. PMID: 25074363
-
Predicting adult height from DNA variants in a European-Asian admixed population.Int J Legal Med. 2019 Nov;133(6):1667-1679. doi: 10.1007/s00414-019-02039-8. Epub 2019 Apr 12. Int J Legal Med. 2019. Retraction in: Int J Legal Med. 2021 Nov;135(6):2151. doi: 10.1007/s00414-021-02692-y. PMID: 30976986 Retracted.
-
Identification and analysis of genomic regions with large between-population differentiation in humans.Ann Hum Genet. 2008 Jan;72(Pt 1):99-110. doi: 10.1111/j.1469-1809.2007.00390.x. Ann Hum Genet. 2008. PMID: 18184145
Cited by
-
Heterogeneous genetic architectures of prostate cancer susceptibility in sub-Saharan Africa.Nat Genet. 2024 Oct;56(10):2093-2103. doi: 10.1038/s41588-024-01931-3. Epub 2024 Oct 2. Nat Genet. 2024. PMID: 39358599
-
Risk factors associated with the Motoric Cognitive Risk syndrome: A meta-analysis of data from a cross-national study.J Am Geriatr Soc. 2024 Sep;72(9):2656-2666. doi: 10.1111/jgs.19032. Epub 2024 Jun 14. J Am Geriatr Soc. 2024. PMID: 38872608
-
Age and Sex-related Chromogranin A Gene Polymorphisms and its Association with Metabolic Syndrome Components.J ASEAN Fed Endocr Soc. 2024;39(1):45-52. doi: 10.15605/jafes.039.01.09. Epub 2024 Jan 9. J ASEAN Fed Endocr Soc. 2024. PMID: 38863909 Free PMC article.
-
Associations of the circulating levels of cytokines with the risk of myeloproliferative neoplasms: a bidirectional mendelian-randomization study.BMC Cancer. 2024 Apr 26;24(1):531. doi: 10.1186/s12885-024-12301-x. BMC Cancer. 2024. PMID: 38671390 Free PMC article.
-
Exploring genetic associations of Crohn's disease and ulcerative colitis with extraintestinal cancers in European and East Asian populations.Front Immunol. 2024 Feb 8;15:1339207. doi: 10.3389/fimmu.2024.1339207. eCollection 2024. Front Immunol. 2024. PMID: 38404590 Free PMC article.
References
Publication types
MeSH terms
Associated data
- Actions
Grants and funding
LinkOut - more resources
Full Text Sources
Other Literature Sources
Research Materials

