

SIGMA: a system for integrative genomic microarray analysis of cancer genomes
- PMID: 17192189
- PMCID: PMC1764892
- DOI: 10.1186/1471-2164-7-324
SIGMA: a system for integrative genomic microarray analysis of cancer genomes
Abstract
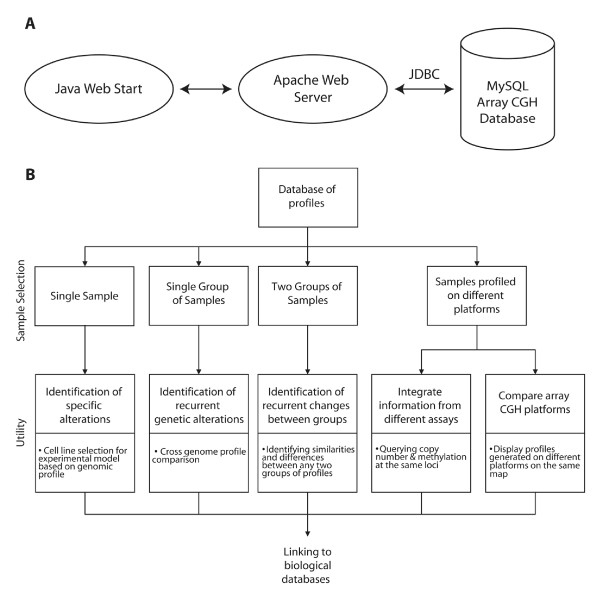
Background: The prevalence of high resolution profiling of genomes has created a need for the integrative analysis of information generated from multiple methodologies and platforms. Although the majority of data in the public domain are gene expression profiles, and expression analysis software are available, the increase of array CGH studies has enabled integration of high throughput genomic and gene expression datasets. However, tools for direct mining and analysis of array CGH data are limited. Hence, there is a great need for analytical and display software tailored to cross platform integrative analysis of cancer genomes.
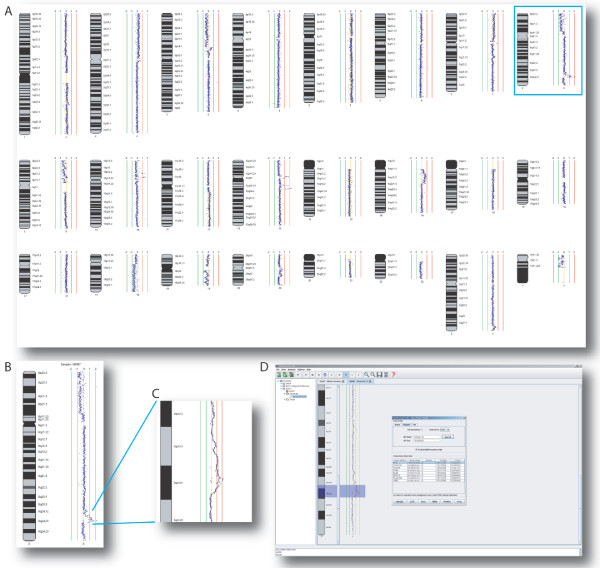
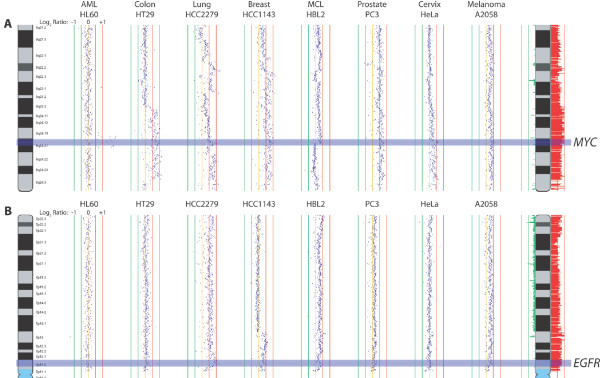
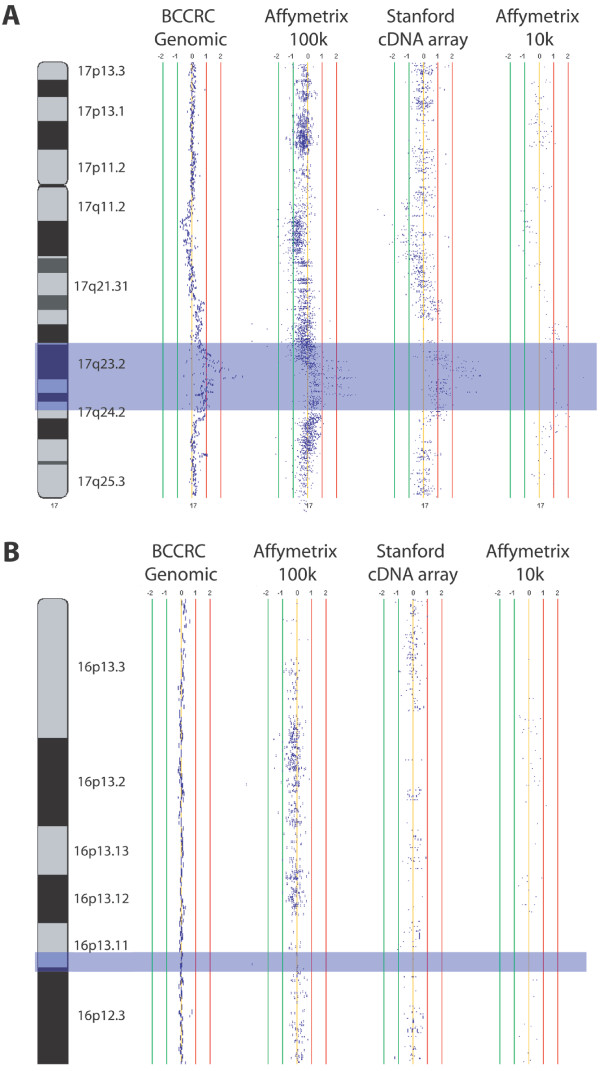
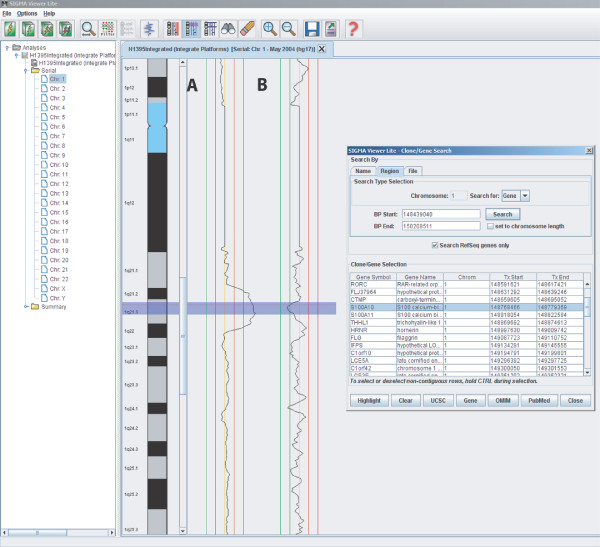
Results: We have created a user-friendly java application to facilitate sophisticated visualization and analysis such as cross-tumor and cross-platform comparisons. To demonstrate the utility of this software, we assembled array CGH data representing Affymetrix SNP chip, Stanford cDNA arrays and whole genome tiling path array platforms for cross comparison. This cancer genome database contains 267 profiles from commonly used cancer cell lines representing 14 different tissue types.
Conclusion: In this study we have developed an application for the visualization and analysis of data from high resolution array CGH platforms that can be adapted for analysis of multiple types of high throughput genomic datasets. Furthermore, we invite researchers using array CGH technology to deposit both their raw and processed data, as this will be a continually expanding database of cancer genomes. This publicly available resource, the System for Integrative Genomic Microarray Analysis (SIGMA) of cancer genomes, can be accessed at http://sigma.bccrc.ca.
Figures
Similar articles
-
ACTuDB, a new database for the integrated analysis of array-CGH and clinical data for tumors.Oncogene. 2007 Oct 11;26(46):6641-52. doi: 10.1038/sj.onc.1210488. Epub 2007 May 14. Oncogene. 2007. PMID: 17496932
-
SeeGH--a software tool for visualization of whole genome array comparative genomic hybridization data.BMC Bioinformatics. 2004 Feb 9;5:13. doi: 10.1186/1471-2105-5-13. BMC Bioinformatics. 2004. PMID: 15040819 Free PMC article.
-
Recent advances in array comparative genomic hybridization technologies and their applications in human genetics.Eur J Hum Genet. 2006 Feb;14(2):139-48. doi: 10.1038/sj.ejhg.5201531. Eur J Hum Genet. 2006. PMID: 16288307 Review.
-
Combined array-comparative genomic hybridization and single-nucleotide polymorphism-loss of heterozygosity analysis reveals complex genetic alterations in cervical cancer.BMC Genomics. 2007 Feb 20;8:53. doi: 10.1186/1471-2164-8-53. BMC Genomics. 2007. PMID: 17311676 Free PMC article.
-
Array CGH technologies and their applications to cancer genomes.Chromosome Res. 2005;13(3):237-48. doi: 10.1007/s10577-005-2168-x. Chromosome Res. 2005. PMID: 15868418 Review.
Cited by
-
Oncogene mutations, copy number gains and mutant allele specific imbalance (MASI) frequently occur together in tumor cells.PLoS One. 2009 Oct 14;4(10):e7464. doi: 10.1371/journal.pone.0007464. PLoS One. 2009. PMID: 19826477 Free PMC article.
-
SIGMA2: a system for the integrative genomic multi-dimensional analysis of cancer genomes, epigenomes, and transcriptomes.BMC Bioinformatics. 2008 Oct 7;9:422. doi: 10.1186/1471-2105-9-422. BMC Bioinformatics. 2008. PMID: 18840289 Free PMC article.
-
Loss of the Notch effector RBPJ promotes tumorigenesis.J Exp Med. 2015 Jan 12;212(1):37-52. doi: 10.1084/jem.20121192. Epub 2014 Dec 15. J Exp Med. 2015. PMID: 25512468 Free PMC article.
-
A Multi-way Multi-task Learning Approach for Multinomial Logistic Regression*. An Application in Joint Prediction of Appointment Miss-opportunities across Multiple Clinics.Methods Inf Med. 2017 Aug 11;56(4):294-307. doi: 10.3414/ME16-01-0112. Epub 2017 Jun 7. Methods Inf Med. 2017. PMID: 28590498 Free PMC article.
-
Deciphering squamous cell carcinoma using multidimensional genomic approaches.J Skin Cancer. 2011;2011:541405. doi: 10.1155/2011/541405. Epub 2010 Dec 27. J Skin Cancer. 2011. PMID: 21234096 Free PMC article.
References
-
- Parkinson H, Sarkans U, Shojatalab M, Abeygunawardena N, Contrino S, Coulson R, Farne A, Lara GG, Holloway E, Kapushesky M, Lilja P, Mukherjee G, Oezcimen A, Rayner T, Rocca-Serra P, Sharma A, Sansone S, Brazma A. ArrayExpress--a public repository for microarray gene expression data at the EBI. Nucleic Acids Res. 2005;33:D553–5. doi: 10.1093/nar/gki056. - DOI - PMC - PubMed
Publication types
MeSH terms
Substances
Grants and funding
LinkOut - more resources
Full Text Sources
Other Literature Sources
