. 2006 Dec 18;175(6):947-55.
doi: 10.1083/jcb.200604176.

Actin turnover-dependent fast dissociation of capping protein in the dendritic nucleation actin network: evidence of frequent filament severing

Affiliations

Actin turnover-dependent fast dissociation of capping protein in the dendritic nucleation actin network: evidence of frequent filament severing

Takushi Miyoshi et al. J Cell Biol. .

Abstract

Actin forms the dendritic nucleation network and undergoes rapid polymerization-depolymerization cycles in lamellipodia. To elucidate the mechanism of actin disassembly, we characterized molecular kinetics of the major filament end-binding proteins Arp2/3 complex and capping protein (CP) using single-molecule speckle microscopy. We have determined the dissociation rates of Arp2/3 and CP as 0.048 and 0.58 s(-1), respectively, in lamellipodia of live XTC fibroblasts. This CP dissociation rate is three orders of magnitude faster than in vitro. CP dissociates slower from actin stress fibers than from the lamellipodial actin network, suggesting that CP dissociation correlates with actin filament dynamics. We found that jasplakinolide, an actin depolymerization inhibitor, rapidly blocked the fast CP dissociation in cells. Consistently, the coexpression of LIM kinase prolonged CP speckle lifetime in lamellipodia. These results suggest that cofilin-mediated actin disassembly triggers CP dissociation from actin filaments. We predict that filament severing and end-to-end annealing might take place fairly frequently in the dendritic nucleation actin arrays.


Figures
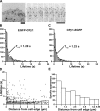
Figure 1.
Figure 1.
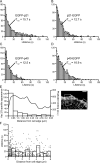
Lifetime distribution of single-molecule CP speckles in lamellipodia. (A) Speckle images in an XTC cell expressing a low amount of EGFP-CPβ1 (left) and associated time-lapse images at intervals of 500 ms (right). (B and C) Speckle lifetime distribution of EGFP-CPβ1 (n = 1,195) in two cells (B) and CPβ1-EGFP (n = 793) in three cells (C). CP speckles with single EGFP intensity, which appeared over the course of a 15-s time window, were followed. Bars show the number of speckles with indicated lifetimes after normalization for photobleaching. Dashed lines show the single exponential curve fit with lifetime distribution data between 1.0 and 5.5 s, and its decay rate is expressed as half-life (t 1/2). (D) Lifetime versus position plot of CP speckle lifetime data. Dots represent the lifetime and emerging position of individual EGFP-CPβ1 speckles. Bars represent the mean speckle lifetime after correction for photobleaching. A representative result of two independent measurements is shown. (E) The position of EGFP-CPβ1 speckles that had appeared over 30 consecutive images was recorded. Bars represent the number of newly emerged CP speckles in each indicated position. A representative result of three independent measurements is shown. Bars, 5 μm.
Figure 2.
Figure 2.
Verification of EGFP-tagged CP probes. (A) CPα2/EGFP-CPβ1 heterodimer purified from E. coli stained with Coomassie Brilliant blue. Numbers indicate the molecular mass in kilodaltons. (B) Effect of recombinant CPα2/EGFP-CPβ1 on actin polymerization from F-actin seeds. The change in pyrene-actin (1 μM) fluorescence after simultaneous mixing with preformed F-actin seeds and indicated concentrations of CPα2/EGFP-CPβ1 is plotted. Solid lines show the curves predicted from kinetic modeling of actin polymerization at the CP on rate of 3.9 μM−1s−1 and the CP off rate of 1.9 × 10⁻³ s−1. (C) Change in steady-state pyrene-actin fluorescence with varying concentrations of CPα2/EGFP-CPβ1 (circles). The line shows the curve optimized for fluorescence data (circles), which was calculated using 1.3 nM for Kd between CP and barbed ends. (D) Slow dissociation of EGFP-CPβ1 after permeabilization. Cells expressing EGFP-CPβ1 were permeabilized with 0.1% Triton X-100 in CB for 10 s, and time-lapse images were acquired in a buffer (10 mM Hepes, pH 7.4, 100 mM KCl, 2 mM MgCl2, 0.2 mM EGTA, and 1 mM DTT; top). Time is given in minutes and seconds. Graph shows the fluorescence intensity of EGFP-CPβ1. Dashed line shows the single exponential curve fit with fluorescence data, which gives the decay rate of 1.7 × 10⁻⁴ s−1. (E) Preservation of EGFP-CPβ1 speckles during the permeabilization procedure. The top and bottom images show EGFP-CPβ1 speckles in an XTC cell before and after permeabilization, respectively, performed as in D. The loss of EGFP-CPβ1 signals between two images as a result of photobleaching is ∼15%. Bars, 5 μm.
Figure 3.
Figure 3.
Lifetime distribution of single-molecule Arp2/3 complex speckles in lamellipodia. (A–D) Speckle lifetime distribution of EGFP-p21 (n = 1088; A), p21-EGFP (n = 736; B), EGFP-p40 (n = 955; C), and p40-EGFP (n = 865; D) in two cells in the lamellipodia of XTC cells spreading on PLL-coated glass coverslips. Arp2/3 speckles with single-molecule EGFP fluorescence intensity that appeared over the course of a 90-s time window were followed in each analysis. Bars show the number of speckles with the indicated lifetime after correction for photobleaching. Dashed lines show the single exponential curve fit with data between 6 and 48 s, and its decay rate is expressed as half-life (t 1/2). (E) Images of EGFP-p40 speckles were acquired at intervals of 3 s, and cells were fixed and stained with phalloidin (right). The areas devoid of dense clusters of speckles (boxed areas; right) were chosen for analysis. The position of Arp2/3 speckles that had appeared over 30 consecutive images (n = 214) was recorded. The curve represents the actin filament distribution measured by phalloidin binding. Bars represent the number of newly emerged Arp2/3 speckles in each indicated position. A representative result of two independent measurements is shown. Bar, 5 μm. (F) Lifetime versus position plot of Arp2/3 speckle lifetime data. Dots represent the lifetime and emerging position of individual EGFP-p21 speckles (n = 516). Bars represent the mean speckle lifetime after correction for photobleaching. A representative result of four independent measurements is shown.
Figure 4.
Figure 4.
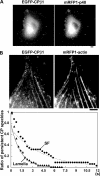
Slower dissociation kinetics of CP associated with actin SFs. (A) Colocalization of CP and Arp2/3 at the leading edge and cytoplasmic punctate actin structures in a spreading XTC cell. A live XTC cell expressing EGFP-CPβ1 (left) and mRFP1-p40 (right) 2 h after seeding onto a PLL-coated glass coverslip. (B) Association of CP with actin stress fibers (SF). A live XTC cell expressing EGFP-CPβ1 (top left) and mRFP1-actin (top right) 4.5 h after seeding onto a PLL-coated glass coverslip. The graph shows decay in the number of persistent EGFP-CPβ1 speckles located on SFs (circles) and in the lamella area away from SFs (triangles) in the same cell. Lines: the single exponential curve fit gives 2.9 and 0.95 s for the half-life of CP on SFs (dotted) and away from SFs (solid), respectively, after normalization for photobleaching. A representative result of two measurements is shown. Bars, 5 μm.
Figure 5.
Figure 5.
Rapid, marked stabilization of CP upon Jas treatment. Images of EGFP-CPβ1 speckles in live XTC cells were acquired at 2-s intervals before perfusion and at 10-s intervals 1 min after the perfusion of 1 μM Jas. The decay of persistent single-molecule CP speckles before (circles) and ∼1–5 min after (triangles) perfusion is shown. The normalized half-life of persistent CP speckles rapidly increased from 4.26 (solid line) to 68.9 s (dotted line) upon Jas treatment. A representative result of three measurements is shown.
Figure 6.
Figure 6.
The dissociation rate of CP speckles is reduced by coexpression of LIMK. XTC cells were transfected with various ratios of the mixture of delCMV-EGFP-CPβ1 and pmRFP1–hLIMK-1 and were allowed to spread on PLL-coated coverslips for 0.5–2 h. Circles show the half-life of single-molecule CP speckles in lamellipodia of cells (n = 4) transfected with delCMV-EGFP-CPβ1 alone. The half-life of single-molecule CP speckles in lamellipodia and the total RFP fluorescence intensity in individual cells were plotted (triangles).
Figure 7.
Figure 7.
Models for actin dynamics–dependent fast CP dissociation and filament turnover kinetics in the dendritic nucleation actin arrays. (A) Direct inhibition of CP dissociation by Jas. Jas might stabilize the CP–barbed end interaction through conformational changes in the filament, and cofilin might have the opposite effect. (B) Preferential filament severing near the barbed end. Both models (A and B) predict an unknown barbed end–specific regulation in the mechanism of cofilin-mediated actin disassembly. (C) Alternatively, filament severing might occur at a high frequency. In this model, end-to-end annealing will be required to prevent fast actin disassembly and uncontrolled growth of free barbed ends. Because CP dissociates one order of magnitude faster than actin and Arp2/3, this model predicts that severing may occur several times in a single filament before disassembly. (D) Summary of the kinetics of actin filament turnover regulation. The present single-molecule speckle analysis revealed 0.048 and 0.58 s−1 for the dissociation rates of Arp2/3 and CP, respectively. We have also reevaluated the speed to the FH2 mutant of mDia1 in lamellipodia and determined the growth rate of free barbed ends as ∼66 subunits/s (Fig. S5, available at http://www.jcb.org/cgi/content/full/jcb.200604176/DC1). Thus, the growth of barbed ends is not strictly limited by capping, whereas disassembly from the Arp2/3-bound pointed ends starts slowly. Therefore, we predict that filament severing is required to achieve fast actin disassembly in lamellipodia. End-to-end filament annealing probably contributes to the neutralization of free barbed ends generated by nucleation and severing. Our data also predict that CP as well as a fraction of actin may dissociate from the network as small actin oligomers.

Similar articles

Cited by

References

    1. Abraham, V.C., V. Krishnamurthi, D.L. Taylor, and F. Lanni. 1999. The actin-based nanomachine at the leading edge of migrating cells. Biophys. J. 77:1721–1732. - PMC - PubMed
    1. Amann, K.J., and T.D. Pollard. 2001. Direct real-time observation of actin filament branching mediated by Arp2/3 complex using total internal reflection fluorescence microscopy. Proc. Natl. Acad. Sci. USA. 98:15009–15013. - PMC - PubMed
    1. Andrianantoandro, E., L. Blanchoin, D. Sept, J.A. McCammon, and T.D. Pollard. 2001. Kinetic mechanism of end-to-end annealing of actin filaments. J. Mol. Biol. 312:721–730. - PubMed
    1. Azuma, T., W. Witke, T.P. Stossel, J.H. Hartwig, and D.J. Kwiatkowski. 1998. Gelsolin is a downstream effector of rac for fibroblast motility. EMBO J. 17:1362–1370. - PMC - PubMed
    1. Bamburg, J.R. 1999. Proteins of the ADF/cofilin family: essential regulators of actin dynamics. Annu. Rev. Cell Dev. Biol. 15:185–230. - PubMed

Publication types

MeSH terms