. 2007 Feb;27(4):1254-63.
doi: 10.1128/MCB.01661-06. Epub 2006 Dec 11.

Interplay between chromatin and trans-acting factors on the IME2 promoter upon induction of the gene at the onset of meiosis

Affiliations

Interplay between chromatin and trans-acting factors on the IME2 promoter upon induction of the gene at the onset of meiosis

Tomomi Inai et al. Mol Cell Biol. 2007 Feb.

Abstract

The IME2 gene is one of the key regulators of the initiation of meiosis in budding yeast. This gene is repressed during mitosis through the repressive chromatin structure at the promoter, which is maintained by the Rpd3-Sin3 histone deacetylase (HDAC) complex. IME2 expression in meiosis requires Gcn5/histone acetyltransferase, the transcriptional activator Ime1, and the chromatin remodeler RSC; however, the molecular basis of IME2 activation had not been previously defined. We found that, during mitotic growth, a nucleosome masked the TATA element of IME2, and this positioning depended on HDAC. This chromatin structure was remodeled at meiosis by RSC that was recruited to TATA by Ime1. Stable tethering of Ime1 to the promoter required the presence of Gcn5. Interestingly, Ime1 binding to the promoter was kept at low levels during the very early stages in meiosis, even when the levels of Ime1 and histone H3 acetylation at the promoter were at their highest, making a 4- to 6-h delay of the IME2 expression from that of IME1. HDAC was continuously present at the promoter regardless of the transcriptional condition of IME2, and deletion of RPD3 allowed the IME2 expression shortly after the expression of IME1, suggesting that HDAC plays a role in regulating the timing of IME2 expression.


Figures
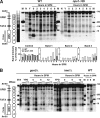
FIG. 1.
FIG. 1.
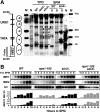
Analysis of chromatin structure of the IME2 gene. (A) Wild type (WT; W303-1D) or nps1-105 (WTH1-D) cells were harvested at the indicated times and processed for MNase digestion. Positions of nucleosomes with respect to the IME2 sequence are schematically indicated on the left side of the figure. MNase cleavage sites enhanced or not enhanced (control) in the wild type are marked with closed or open triangles, respectively. Southern blots were scanned by a Bioimaging analyzer, and the percentage of the newly appeared bands in SPM, relative to all bands produced in the same lane was calculated (bar graphs below the panel). N, the naked DNA control; Y, the sample from cells vegetatively growing in YPD medium. From the top, the sizes of the marker bands are 992, 512, 368, and 267 bp. The nucleotide positions of the IME2 ORF corresponding to each marker band are indicated on the right side. This experiment was performed three times with good consistency. Typical results are presented. (B) MNase mapping was carried out on gcn5Δ (WTI20-D) or ime1Δ (WMY10-D) cells as described for panel A.
FIG. 2.
FIG. 2.
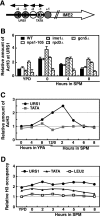
Histone H3 modification at the IME2 promoter. (A) A schematic model for the chromatin structure at the IME2 promoter. Positions of the PCR fragments used for ChIP analysis are shown with respect to the nucleosomal organization of the repressed promoter (Fig. 1). Nucleosomes remodeled at the active promoter are indicated by open circles. URS1 (black box) and the TATA box (open box) are also indicated. (B) ChIP analysis of acetylated histone H3 levels over the IME2 URS1. DNA was immunoprecipitated with anti-acetylated histone H3 from wild type (WT; W303-1D), nps1-105 (WTH1-D), gcn5Δ (WTI20-D), ime1Δ (WMY10-D), and rpd3Δ (WHS20-D) cells. The amount of immunoprecipitated DNA was determined by PCR with primer pairs directed against IME2-URS1. As a control, a primer set was also used for a region 0.5 kb from the telomere of chromosome VI-R (TEL). The relative amount of acetylated histone H3 was determined as the ratio of immunoprecipitated URS1 product relative to the TEL product divided by the ratio of the respective input product. The values are shown with the amount of vegetatively growing (YPD) wild-type cells given as 1. The values shown are averages of three independent experiments. (C) Time course of histone H3-acetylation in the wild-type strain. The amount of immunoprecipitated DNA was determined by PCR and calculated as described for panel B and is shown as a relative amount with the value of the URS1 of YPD-grown cells (0 h of YPA) referred to as 1. The values are averages of four independent experiments. The standard deviation was within ±0.3. (D) ChIP analysis of histone H3 levels over the IME2 promoter. The amount of DNA coimmunoprecipitated with anti-histone H3 carboxy terminus was determined by PCR with primer pairs directed against the IME2-URS1 and TATA regions. As a control, the primer set was also used for LEU2. Relative histone occupancy was determined as the ratio of immunoprecipitated URS1 and TATA products relative to the LEU2 product of YPD-grown cells given as 1, after normalization with the ratio of input products. The value at each time point is an average of three independent experiments. The standard deviation was within ±0.3 for LEU2 and TATA and ±0.5 for URS1.
FIG. 3.
FIG. 3.
Binding of Ime1-HA and Nps1-TAP to the IME2 URS1 site. The strains used were WMY11-D (A), WHK40-D (B), WMY12-D (C), and WMY13-D (D). The cells were harvested at the indicated times, divided into two portions, and processed for ChIP analysis and immunoblotting. The amount of immunoprecipitated DNA obtained by anti-HA antibody (A, C, and D) or IgG-Sepharose (B) was determined by PCR with primer pairs directed against IME2-URS1, calculated as described in the legend to Fig. 2B, and shown as a relative amount with the value of the YPD-grown cells (Y) of each strain taken as 1. As a control, a primer set for the telomere of chromosome VI-R (TEL) (A, C, and D) or HTA1 ORF (B), on which no binding of RSC occurs (19), was used. The ratio of the URS1 signal to the TEL signal or to the HTA1 signal of untagged samples was almost equivalent to that of input samples. The values are averages of three independent experiments. Ime1-HA and Nps1-TAP were detected with anti-HA and anti-Nps1 antibody, respectively.
FIG. 4.
FIG. 4.
Nps1/RSC transiently binds to the IME2 TATA box. (A) Time course of Nps1-TAP binding to the IME2 TATA sequence. The strains used were WHK40-D (IME1) and WMY14-D (ime1Δ). The amount of immunoprecipitated DNA was determined by PCR with primer pairs directed against the IME2 TATA, calculated as described in the legend to Fig. 2B and shown as a relative amount referring to the value of the YPD-grown cells (Y) of IME1 as 1. As a control, a primer set for HTA1 ORF was used. The ratio of the TATA signal to the HTA1 signal of untagged samples was almost equivalent to that of input samples. The values are averages of three independent experiments. (B) Ime1-HA is copurified with Nps1-TAP. The NPS1-TAP IME1-HA (WMY15-D) or NPS1 IME1-HA (minus TAP tag; WMY11-D) cells were harvested at the indicated times and processed for TAP. Proteins eluted from a calmodulin-Sepharose gel were concentrated by lyophilization and then immunoblotted with anti-HA and anti-Nps1 antibodies.
FIG. 5.
FIG. 5.
Effects of RPD3 and SIN3 deletions on the chromatin structure and the expression of the IME2 gene. (A) Nucleosome mapping by MNase digestion for the rpd3Δ (WHS20-D) and sin3Δ (WMY30-D) strains. Numbers indicate the time in hours (h) after the shift to SPM, and N denotes the naked DNA control. WT, wild type. Markers are as described in the legend to Fig. 1. (B) Northern blot analysis of IME1 and IME2 mRNA levels in the sin3Δ and nps1-105 sin3Δ cells. The strains used were wild type (W303-1D), nps1-105 (WTH-1D), sin3Δ (WMY30-D), and nps1-105 sin3Δ (WMY31-D). RNA samples were hybridized with radioactively labeled IME1 and IME2 probes. The U3 small nuclear RNA probe was used as a loading control. These experiments were performed three times with good consistency. Typical results are presented.
FIG. 6.
FIG. 6.
The Rpd3-Sin3 complex is continuously present at the URS1 site. Wild-type (WT; W303-1D) and nps1-105 (WTH-1D) cells were processed for ChIP analysis with anti-Rpd3 antibody (-ab). Y denotes a sample from cells vegetatively growing in YPD medium, and numbers indicate the time in hours after the shift to SPM. Typical results are presented in the upper two panels. The average amount of immunoprecipitated DNA obtained from five independent experiments was calculated and processed as described in the legend to Fig. 2B and is shown as a bar graph at the bottom.
FIG. 7.
FIG. 7.
A model for the transcriptional regulation of IME2 by chromatin remodelers and Ime1. When the cells are vegetatively growing in rich medium containing either glucose or acetate as the sole carbon source (YPD and YPA), four nucleosomes indicated as −1 to −4 are positioned at the promoter of IME2 in an ordered array where nucleosome −1 masks the two TATA sequences. The proper positioning of −1 and −2 nucleosomes is fully dependent on the Rpd3-Sin3 complex, and the gene expression is completely repressed. When acetate is the sole carbon source (YPA), a gradual increase in the histone H3 acetylation at nucleosomes −3 and −4 takes place. The acetylated state of nucleosomes −3 and −4 might affect the higher-order chromatin structure, but does not alter the positioning of nucleosomes in the ordered array, and the gene is still in the repressed condition. When the cells are transferred to SPM, Ime1 expression is accelerated and activated by phosphorylation. However, at the very early stages in SPM (0 to ∼2 h), the binding of Ime1 is prevented by some unidentified factor(s) (X) in a manner dependent on the Rpd3-Sin3 complex. Then, Ime1 binds to Ume6 and, in turn, recruits RSC, and the remodeling of nucleosomes −1 and −2 by RSC occurs to allow gene expression.

Similar articles

Cited by

References

    1. Arévalo-Rodriguez, M., M. E. Cardenas, X. Wu, S. D. Hanes, and J. Heitman. 2000. Cyclophilin A and Ess1 interact with and regulate silencing by the Sin3-Rpd3 histone deacetylase. EMBO J. 19:3739-3749. - PMC - PubMed
    1. Bernstein, B. E., J. K. Tong, and S. L. Schreiber. 2000. Genome wide studies of histone deacetylase function in yeast. Proc. Natl. Acad. Sci. USA 97:13708-13713. - PMC - PubMed
    1. Boeger, H., J. Griesenbeck, J. S. Strattan, and R. D. Kornberg. 2003. Nucleosomes unfold completely at a transcriptionally active promoter. Mol. Cell 11:1587-1598. - PubMed
    1. Bowdish, K. S., and A. P. Mitchell. 1993. Bipartite structure of an early meiotic upstream activation sequence from Saccharomyces cerevisiae. Mol. Cell. Biol. 13:2172-2181. - PMC - PubMed
    1. Burgess, S. M., M. Ajimura, and N. Kleckner. 1999. GCN5-dependent histone H3 acetylation and RPD3-dependent histone H4 deacetylation have distinct, opposing effects on IME2 transcription, during meiosis and during vegetative growth, in budding yeast. Proc. Natl. Acad. Sci. USA 96:6835-6840. - PMC - PubMed

Publication types

MeSH terms