

In CD4+ T-cell-induced diabetes, macrophages are the final effector cells that mediate islet beta-cell killing: studies from an acute model
- PMID: 17148676
- PMCID: PMC1762478
- DOI: 10.2353/ajpath.2006.060539
In CD4+ T-cell-induced diabetes, macrophages are the final effector cells that mediate islet beta-cell killing: studies from an acute model
Abstract
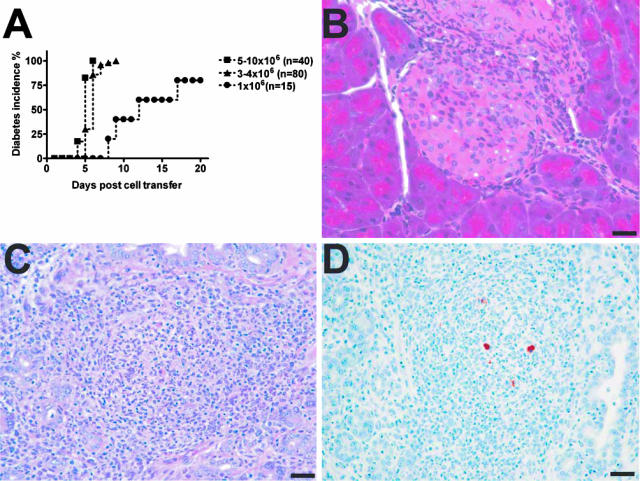
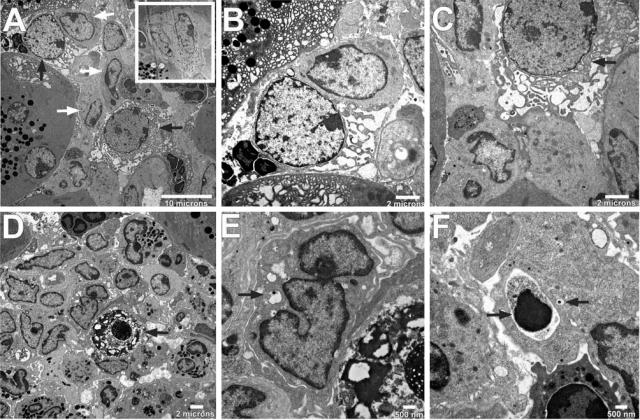
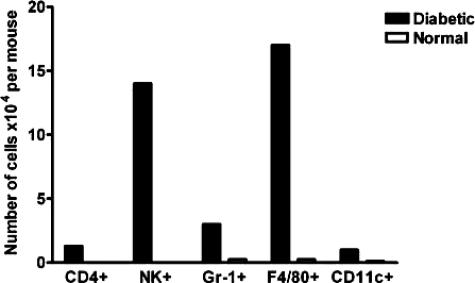
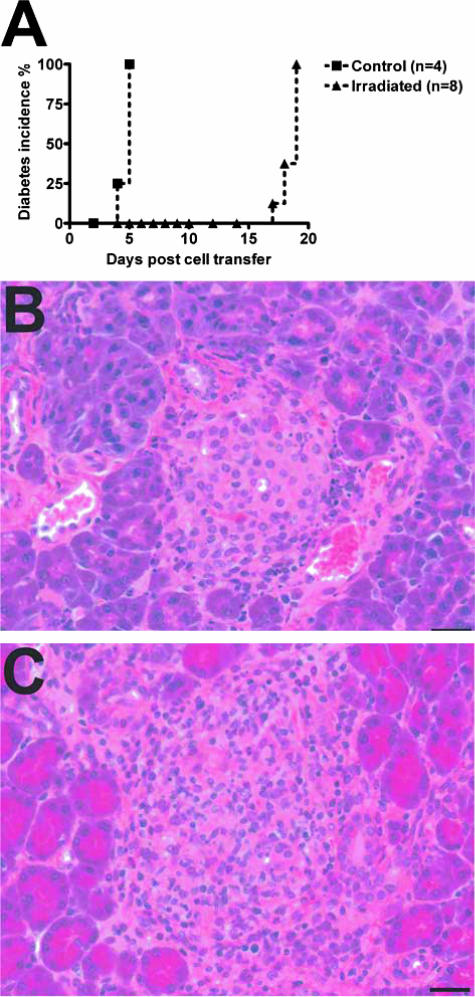
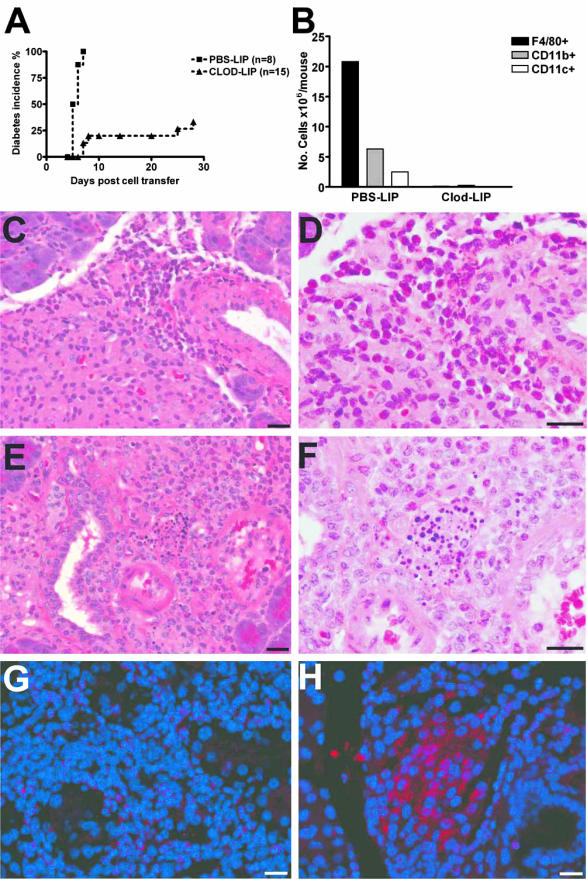
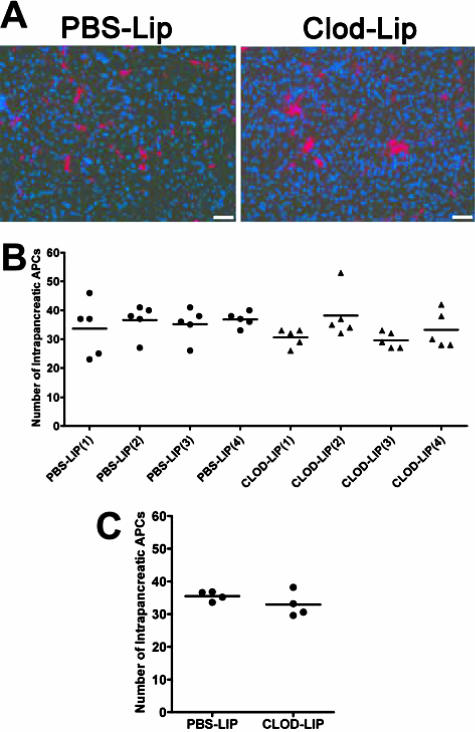
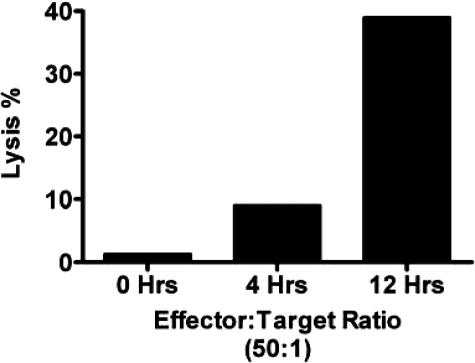
To understand better how diabetogenic CD4+ T cells induce islet beta-cell death and cause diabetes, a transfer model of acute diabetes using the diabetogenic CD4+ BDC2.5 T-cell clone was established. Transfer of activated BDC T cells into NOD.scid mice resulted in diabetes within a week, characterized by strong inflammatory reaction. Electron micrographs of pancreas depicted macrophages in close contact with beta cells that exhibited signs of apoptosis. Transfer into irradiated recipients inhibited inflammation and the development of diabetes, demonstrating an obligatory role for leukocytes. Selective depletion of neutrophils or natural killer cells had no effect on diabetes induced by BDC2.5 T cells. In contrast, in vivo depletion of phagocytic cells by injection of liposomes containing clodronate abolished diabetes, although inflammation remained present and was characterized mainly by neutrophil infiltration. Treatment with clodronate-liposomes did not affect the antigen-presenting cells within the pancreas. Last, activated macrophages isolated from infiltrated pancreas exhibited cytolytic activity toward primary islet beta cells. Taken together, these results demonstrate that activated macrophages are the key cells mediating islet beta-cell death induced by activated CD4+ T cells.
Figures

Similar articles
-
IFN-gamma-dependent regulatory circuits in immune inflammation highlighted in diabetes.J Immunol. 2008 Nov 15;181(10):6964-74. doi: 10.4049/jimmunol.181.10.6964. J Immunol. 2008. PMID: 18981116 Free PMC article.
-
Regulation of diabetes development by regulatory T cells in pancreatic islet antigen-specific TCR transgenic nonobese diabetic mice.J Immunol. 2002 Jun 15;168(12):6159-64. doi: 10.4049/jimmunol.168.12.6159. J Immunol. 2002. PMID: 12055228
-
Immunohistochemical study of caspase-3-expressing cells within the pancreas of non-obese diabetic mice during cyclophosphamide-accelerated diabetes.Histochem Cell Biol. 2003 Jun;119(6):451-61. doi: 10.1007/s00418-003-0537-0. Epub 2003 Jun 11. Histochem Cell Biol. 2003. PMID: 12802593
-
Transfer of diabetes in the NOD-scid mouse by CD4 T-cell clones. Differential requirement for CD8 T-cells.Diabetes. 1996 Mar;45(3):328-36. doi: 10.2337/diab.45.3.328. Diabetes. 1996. PMID: 8593938
-
In vivo activity of an islet-reactive T-cell clone.J Autoimmun. 1990 Aug;3(4):449-56. doi: 10.1016/s0896-8411(05)80012-5. J Autoimmun. 1990. PMID: 1977404
Cited by
-
The Role of Programmed Death-1 in Type 1 Diabetes.Curr Diab Rep. 2021 May 6;21(6):20. doi: 10.1007/s11892-021-01384-6. Curr Diab Rep. 2021. PMID: 33956235 Free PMC article. Review.
-
Lipid mediators and biomarkers associated with type 1 diabetes development.JCI Insight. 2020 Aug 20;5(16):e138034. doi: 10.1172/jci.insight.138034. JCI Insight. 2020. PMID: 32814707 Free PMC article.
-
Peptide-MHC-based nanomedicines for autoimmunity function as T-cell receptor microclustering devices.Nat Nanotechnol. 2017 Jul;12(7):701-710. doi: 10.1038/nnano.2017.56. Epub 2017 Apr 24. Nat Nanotechnol. 2017. PMID: 28436959
-
Mitochondrial Reactive Oxygen Species and Type 1 Diabetes.Antioxid Redox Signal. 2018 Nov 10;29(14):1361-1372. doi: 10.1089/ars.2017.7346. Epub 2018 Feb 15. Antioxid Redox Signal. 2018. PMID: 29295631 Free PMC article. Review.
-
Role of DNA-LL37 complexes in the activation of plasmacytoid dendritic cells and monocytes in subjects with type 1 diabetes.Sci Rep. 2020 Jun 1;10(1):8896. doi: 10.1038/s41598-020-65851-y. Sci Rep. 2020. PMID: 32483133 Free PMC article.
References
-
- Tisch R, McDevitt H. Insulin-dependent diabetes mellitus. Cell. 1996;85:291–297. - PubMed
-
- Kikutani H, Makino S. The murine autoimmune diabetes model: NOD and related strains. Adv Immunol. 1992;51:285–322. - PubMed
-
- Nakhooda AF, Like AA, Chappel CI, Murray FT, Marliss EB. The spontaneously diabetic Wistar rat. Metabolic and morphologic studies. Diabetes. 1977;26:100–112. - PubMed
-
- Katz J, Benoist C, Mathis D. Major histocompatibility complex class I molecules are required for the development of insulitis in non-obese diabetic mice. Eur J Immunol. 1993;23:3358–3360. - PubMed
-
- Mora C, Wong FS, Chang CH, Flavell RA. Pancreatic infiltration but not diabetes occurs in the relative absence of MHC class II-restricted CD4 T cells: studies using NOD/CIITA-deficient mice. J Immunol. 1999;162:4576–4588. - PubMed
Publication types
MeSH terms
Substances
LinkOut - more resources
Full Text Sources
Molecular Biology Databases
Research Materials
