. 2006 Nov;4(12):e423.
doi: 10.1371/journal.pbio.0040423.

Autophagy counterbalances endoplasmic reticulum expansion during the unfolded protein response

Affiliations

Autophagy counterbalances endoplasmic reticulum expansion during the unfolded protein response

Sebastián Bernales et al. PLoS Biol. 2006 Nov.

Abstract

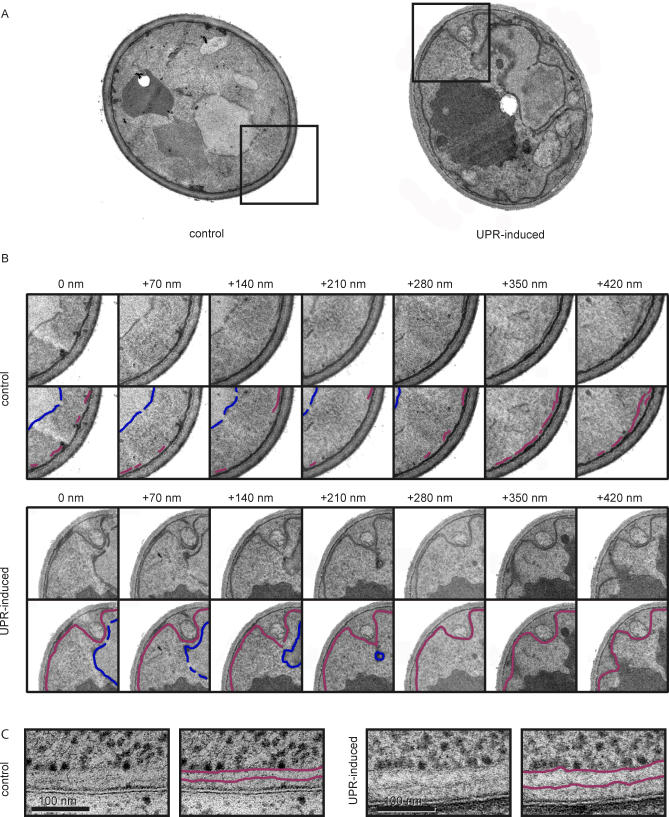
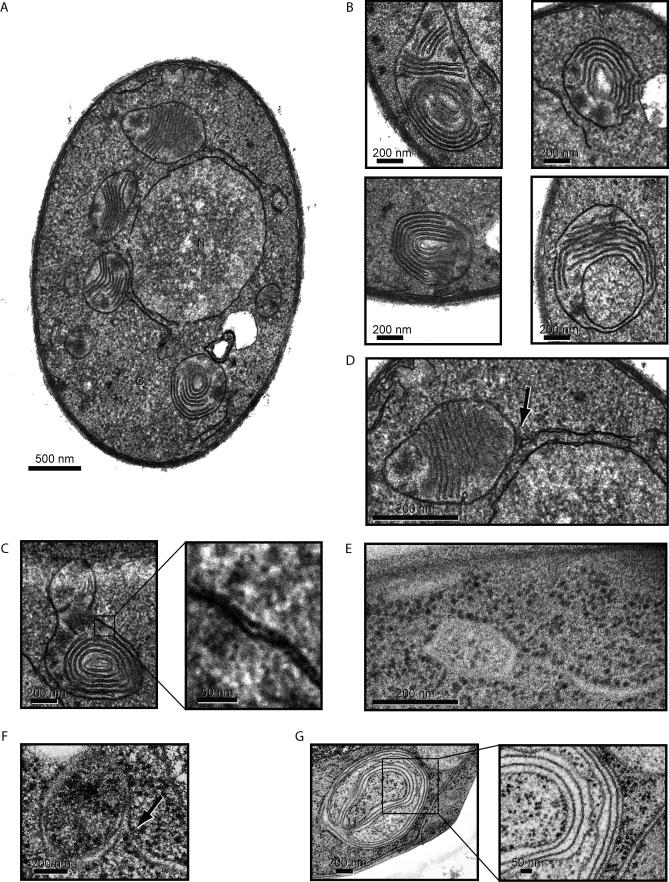
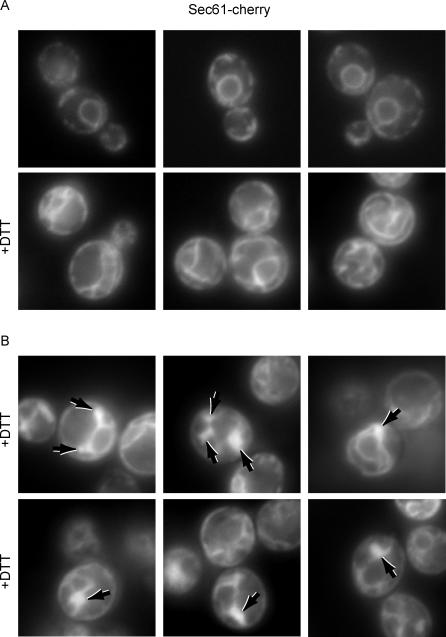
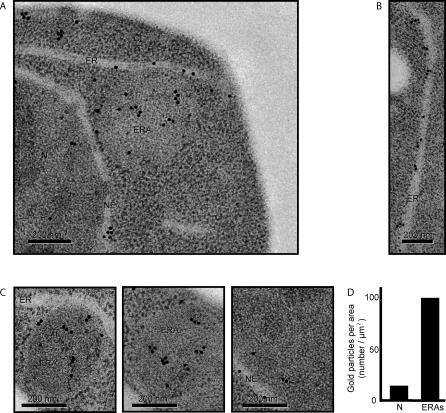
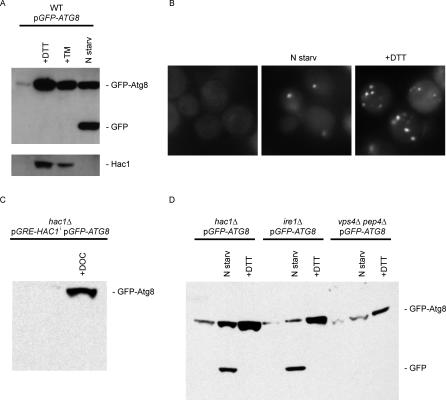
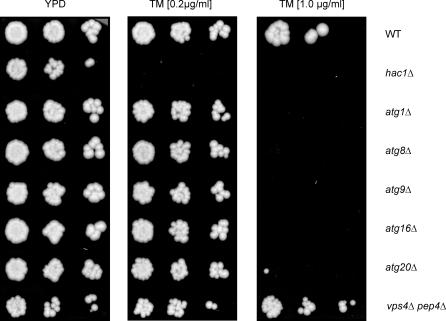
The protein folding capacity of the endoplasmic reticulum (ER) is regulated by the unfolded protein response (UPR). The UPR senses unfolded proteins in the ER lumen and transmits that information to the cell nucleus, where it drives a transcriptional program that is tailored to re-establish homeostasis. Using thin section electron microscopy, we found that yeast cells expand their ER volume at least 5-fold under UPR-inducing conditions. Surprisingly, we discovered that ER proliferation is accompanied by the formation of autophagosome-like structures that are densely and selectively packed with membrane stacks derived from the UPR-expanded ER. In analogy to pexophagy and mitophagy, which are autophagic processes that selectively sequester and degrade peroxisomes and mitochondria, the ER-specific autophagic process described utilizes several autophagy genes: they are induced by the UPR and are essential for the survival of cells subjected to severe ER stress. Intriguingly, cell survival does not require vacuolar proteases, indicating that ER sequestration into autophagosome-like structures, rather than their degradation, is the important step. Selective ER sequestration may help cells to maintain a new steady-state level of ER abundance even in the face of continuously accumulating unfolded proteins.


Conflict of interest statement

Competing interests. The authors have declared that no competing interests exist.

Figures

Figure 1
Figure 1. ER Proliferation under UPR-Inducing Conditions
(A) Determination of ER abundance in control and UPR-induced cells. Representative cells are shown. The UPR was induced in wild-type cells by addition of DTT. Ultrastructure of control cells and UPR-induced cells was analyzed using ImageJ. The lower images show traces of cortical ER (represented in magenta) and the nuclear envelope (NE, in blue). Vacuoles, nuclei, and mitochondria are indicated as V, N, and M, respectively. (B) Quantification of the ER proliferation during the UPR. UPR was induced and cells were collected for EM at the indicated time points. Length of the ER (as traced in [A]) was measured and divided by the area of the section. Data are plotted relative to time 0. Measurements for each time point correspond to the mean of 25 independent cell images. (C) Expression of HAC1i was induced by addition of 100 μM DOC for 3 h. ER was quantified as described above in (B).
Figure 2
Figure 2. The ER Morphologically Changes during the UPR
(A) Control cells and UPR-induced cells were used to analyze and follow the ER within a single cell using EM. Boxes indicate the areas magnified in (B). Cells shown here correspond to the full section of the images labeled “+140 nm” in (B). (B) Serial section of control and UPR-induced cells. Sections are separated by 70 nm on the z-axis. ER is represented in magenta and NE in blue. (C) Electro micrographs from control and UPR-induced cells showing that the distance between ER membranes increases during the UPR. For a better preservation of the ultrastructure, samples for this experiment were prepared using high-pressure freezing/freeze substitution techniques (see Material and Methods).
Figure 3
Figure 3. Characterization of ER-Containing Autophagosomes (ERAs) during the UPR
(A) Images of representative DTT-treated wild-type cells that contain ERAs. Nuclei and cytoplasm are indicated as N and C, respectively. (B) Enlargement of representative images of ERAs from different cells. The bottom right image is likely to show a section through a cup-shaped ERA. Note that there are no connections between the stacked cisternae and the envelope. (C) High magnification of the ERA double membrane envelope. (D) Some ERAs are found attached to or are in close proximity to ER tubules/sheets (indicated by the arrow). Note that the section in (A) includes two such junctions. (E) High-pressure freezing/freeze substitution image of an ERA linked to an ER tubule/sheet. The osmium/lead staining used in this technique visualizes ribosomes and demonstrates that the outer ERA envelope membrane, but not the stacked internal cisternae, are tightly studded with ribosomes, indicating that they originate from ER membranes. (F) High-pressure freezing/freeze substitution image of an ER-ERA junction using an improved protocol to visualize membranes. (G) Using the same technique as in (F), we visualized the internal membrane content of an ERA. Note that both portions of the internal membranes and of the sequestering double membrane envelope contain bound ribosomes, and hence are likely derived from the ER.
Figure 4
Figure 4. Fluorescence Visualization of an ER Marker after UPR Induction
(A) Cells treated with the UPR-inducing drug DTT (+DTT) or with no drug were visualized using a fusion protein between the translocon component Sec61 and the red-fluorescent protein “cherry.” Top panels show untreated cells, and bottom panels show representative UPR-induced cells. (B) Representative images showing UPR-induced cells that contain ERAs (indicated by arrows).
Figure 5
Figure 5. Immunogold Labeling of ERAs with an Antibody Directed against an ER Membrane Marker
(A) Representative section of a cell immunolabeled against a myc-tagged Sec63, an integral ER membrane protein. As a primary antibody, we used a rabbit polyclonal anti-myc and, as a secondary, we used 15-nm gold particles–conjugated anti-rabbit antibody. Nucleus, nuclear envelope, ER, and ERA are indicated as N, NE, ER, and ERA, respectively. (B) High magnification of an electron micrograph of a section of ER. Quantification showed that there are 5 ± 2 gold particles per linear micrometer of ER. (C) High magnification of ERAs. To predict how many gold particles one should expect in a particular ERA, we first calculated and averaged the amount of ER (expressed as length in linear micrometers) present in an ERA (similar to the ones shown in Figure 3B), and normalized the value for its area. These calculations determined that there are 20.8 ± 3.3 μm of ER per μm2 inside the ERAs. These values allowed us to predict how many gold particles would be expected over a section of an ERA if it were packed with ER membranes. Two representative ERAs are shown. The ERA shown in the middle picture should hold 2.4 μm of ER inside and, therefore, should have 12 gold particles. We counted 12 gold particles. The ERA on the right could contain 2.7 μm of ER and should contain14 gold particles; we counted 16 gold particles. The image on the right shows a representative view of a nucleoplasmic region. (D) Quantification of gold-labeling density per area. To assess the signal-to-noise ratio of our immunogold-labeling procedure, we assessed background labeling by counting the number of gold particles over an areas of nucleoplasm (N) and over ERAs, and normalized the counts to the respective areas.
Figure 6
Figure 6. UPR-Induction of the Autophagy Marker GFP-Atg8
(A) Wild-type cells transformed with a plasmid containing GFP-Atg8 were grown for 4 h in synthetic media with no drug, with UPR-inducing conditions (+DTT and +TM), or under nitrogen starvation conditions (N starv), and then harvested for protein preparation. Protein extracts were analyzed by Western blotting using antibodies against GFP (top panel) or Hac1 (bottom panel). Total protein concentration was measured by BCA protein assay. Same concentration of protein was loaded in each lane, and transfer efficiency was checked by Ponceau staining. The identities of the different bands are indicated. (B) Wild-type cells expressing GFP-Atg8 grown under the conditions described above were visualized by fluorescence microscopy. (C) GFP-Atg8 was detected in extracts from untreated hac1Δ cells or cells expressing HAC1i (+DOC) by Western blotting using antibodies against GFP. (D) Western blot using antibodies against GFP of extracts from hac1Δ, ire1Δ, or vps4Δ pep4Δ cells expressing GFP-Atg8. Mutant cells were grown under regular conditions, UPR-inducing conditions (+DTT), or nitrogen starvation conditions (N starv).
Figure 7
Figure 7. Localization of GFP-Atg8 during UPR Induction
Some of the DTT-treated cells shown in Figure 4B expressing GFP-Atg8 and Sec61-cherry (as an ER marker) were visualized using fluorescence microscopy. GFP-Atg8 localizes in close proximity to the ERAs detected by the ER marker.
Figure 8
Figure 8. Atg8 and Other ATG Genes Are Necessary during UPR Induction
Serial dilutions for wild-type, hac1Δ, atg1Δ, atg8Δ, atg9Δ, atg16Δ, and atg20Δ deletion cells and vps4Δ pep4Δ double deletion cells were grown on rich-media plates with no drug (YPD) or with different concentrations of tunicamycin (TM; 0.2 or 1.0 μg/ml). atg19Δ gave an identical result to the other autophagy genes shown here (unpublished data).

Comment in

Similar articles

Cited by

References

    1. Wickner W, Schekman R. Protein translocation across biological membranes. Science. 2005;310:1452–1456. - PubMed
    1. Ellgaard L, Helenius A. Quality control in the endoplasmic reticulum. Nat Rev Mol Cell Biol. 2003;4:181–191. - PubMed
    1. McCracken AA, Brodsky JL. Recognition and delivery of ERAD substrates to the proteasome and alternative paths for cell survival. Curr Top Microbiol Immunol. 2005;300:17–40. - PubMed
    1. Ron D. Translational control in the endoplasmic reticulum stress response. J Clin Invest. 2002;110:1383–1388. - PMC - PubMed
    1. van Anken E, Braakman I. Versatility of the endoplasmic reticulum protein folding factory. Crit Rev Biochem Mol Biol. 2005;40:191–228. - PubMed

Publication types

MeSH terms

Substances