

In vivo pharmacological resultant analysis reveals noncompetitive interactions between opioid antagonists in the rat tail-withdrawal assay
- PMID: 17075571
- PMCID: PMC2014630
- DOI: 10.1038/sj.bjp.0706946
In vivo pharmacological resultant analysis reveals noncompetitive interactions between opioid antagonists in the rat tail-withdrawal assay
Abstract
Background and purpose: Pharmacological resultant analysis is a technique that can detect secondary effects of competitive antagonists in vitro. The utility of pharmacological resultant analysis as a potential tool for the investigation of antagonist interactions in vivo was examined in the present study using two opioid antagonists, naltrexone and CTAP.
Experimental approach: Using the experimental design of pharmacological resultant analysis, the well-characterized opioid antagonist naltrexone was examined in the presence of multiple doses of CTAP to block the antinociceptive effects of morphine in the rat warm-water (55(o)C), tail-withdrawal assay.
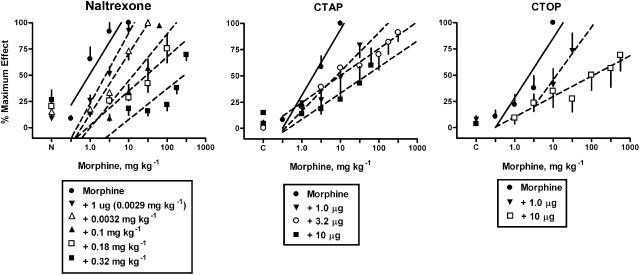
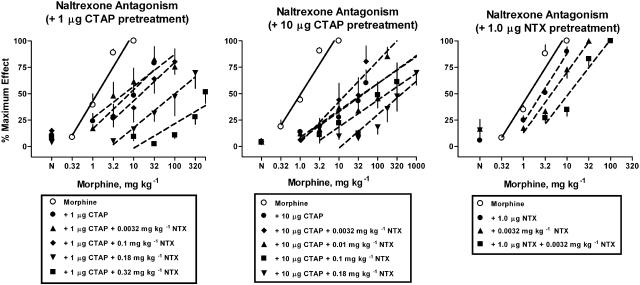
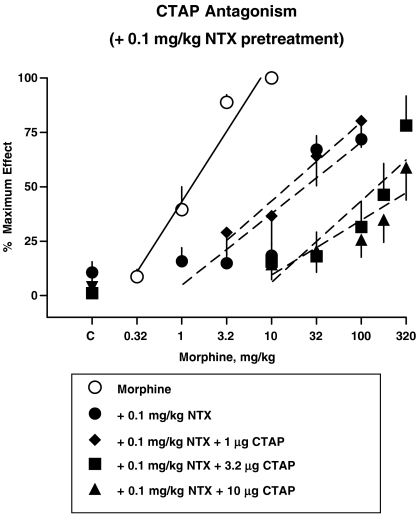
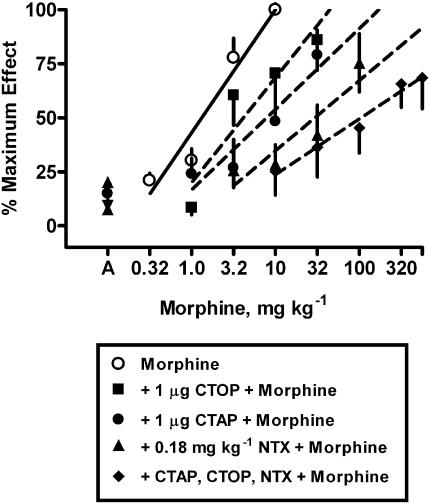
Key results: Alone, all doses of naltrexone, CTAP, and CTOP examined blocked the antinociceptive effects of morphine. In the presence of fixed doses of 1 or 10 microg CTAP, increasing doses of naltrexone produced dose-dependent shifts to the right in the morphine dose-response curve. However, a lower dose of naltrexone in combination with 1 or 10 mug CTAP failed to alter the morphine dose-response curve. In the presence of a fixed dose of 0.1 mg kg(-1) naltrexone, CTAP doses produced irregular shifts to the right in the morphine dose-response curves.
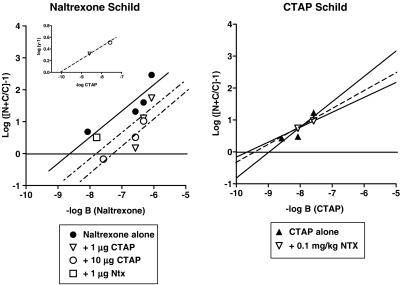
Conclusions and implications: Resultant analysis was applied and an apparent pK(C) value for CTAP was found to be one log unit higher than the apparent pA(2) value for CTAP, evidence that CTAP may have secondary actions or that a signal transducer function may be altered by the combinations of these antagonists. Taken together, these data suggest pharmacological resultant analysis can reveal novel interactions between antagonists in vivo.
Figures
Similar articles
-
Potency differences for D-Phe-Cys-Tyr-D-Trp-Arg-Thr-Pen-Thr-NH2 as an antagonist of peptide and alkaloid micro-agonists in an antinociception assay.J Pharmacol Exp Ther. 2003 Jan;304(1):301-9. doi: 10.1124/jpet.102.042093. J Pharmacol Exp Ther. 2003. PMID: 12490605
-
Pharmacological selectivity of CTAP in a warm water tail-withdrawal antinociception assay in rats.Psychopharmacology (Berl). 2008 Jan;195(4):497-507. doi: 10.1007/s00213-007-0898-5. Epub 2007 Sep 19. Psychopharmacology (Berl). 2008. PMID: 17882404 Free PMC article.
-
Augmentation of spinal morphine analgesia and inhibition of tolerance by low doses of mu- and delta-opioid receptor antagonists.Br J Pharmacol. 2007 Jul;151(6):877-87. doi: 10.1038/sj.bjp.0707277. Epub 2007 May 14. Br J Pharmacol. 2007. PMID: 17502848 Free PMC article.
-
Inhibition of tolerance to spinal morphine antinociception by low doses of opioid receptor antagonists.Eur J Pharmacol. 2007 Apr 10;560(2-3):132-41. doi: 10.1016/j.ejphar.2006.12.013. Epub 2007 Jan 17. Eur J Pharmacol. 2007. PMID: 17307158
-
Interactions of narcotic antagonists.Ann N Y Acad Sci. 1976;281:288-96. doi: 10.1111/j.1749-6632.1976.tb27939.x. Ann N Y Acad Sci. 1976. PMID: 828466 Review. No abstract available.
Cited by
-
Neutral antagonist activity of naltrexone and 6beta-naltrexol in naïve and opioid-dependent C6 cells expressing a mu-opioid receptor.Br J Pharmacol. 2009 Apr;156(7):1044-53. doi: 10.1111/j.1476-5381.2008.00035.x. Epub 2009 Feb 13. Br J Pharmacol. 2009. PMID: 19220294 Free PMC article.
-
Ethanol-induced social facilitation in adolescent rats: role of endogenous activity at mu opioid receptors.Alcohol Clin Exp Res. 2009 Jun;33(6):991-1000. doi: 10.1111/j.1530-0277.2009.00920.x. Epub 2009 Mar 19. Alcohol Clin Exp Res. 2009. PMID: 19302088 Free PMC article.
-
Effect of three peptidase inhibitors on antinociceptive potential and toxicity with intracerebroventricular administration of dynorphin A (1-17) or (1-13) in the rat.J Anesth. 2015 Feb;29(1):65-77. doi: 10.1007/s00540-014-1860-4. Epub 2014 Jun 19. J Anesth. 2015. PMID: 24943455
-
Potentiation of [Met5]enkephalin-induced antinociception by mixture of three peptidase inhibitors in rat.J Anesth. 2014 Oct;28(5):708-15. doi: 10.1007/s00540-014-1819-5. Epub 2014 Apr 5. J Anesth. 2014. PMID: 24705939
-
Endogenous opiates and behavior: 2006.Peptides. 2007 Dec;28(12):2435-513. doi: 10.1016/j.peptides.2007.09.002. Epub 2007 Sep 11. Peptides. 2007. PMID: 17949854 Free PMC article. Review.
References
-
- Abbruscato TJ, Thomas SA, Hruby VJ, Davis TP. Blood-brain barrier permeability and bioavailability of a highly potent and mu–selective opioid receptor antagonist, CTAP: comparison with morphine. J Pharmacol Exp Ther. 1997;280:402–409. - PubMed
-
- Adams JU, Geller EB, Adler MW. Receptor selectivity of icv morphine in the rat cold water tail-flick test. Drug Alcohol Depend. 1994;35:197–202. - PubMed
-
- Berg KA, Stout BD, Cropper JD, Maayani S, Clarke WP. Novel actions of inverse agonists on 5-HT2C receptor systems. Mol Pharmacol. 1999;55:863–872. - PubMed
-
- Bilsky EJ, Bernstein RN, Wang Z, Sadee W, Porreca F. Effects of naloxone and D-Phe-Cys-Tyr-D-Trp-Arg-Thr-Pen-Thr-NH2 and the protein kinase inhibitors H7 and H8 on acute morphine dependence and antinociceptive tolerance in mice. J Pharmacol Exp Ther. 1996;277:484–490. - PubMed
Publication types
MeSH terms
Substances
Grants and funding
LinkOut - more resources
Full Text Sources
