

Gene expression profiling in a mouse model for African trypanosomiasis
- PMID: 17066074
- PMCID: PMC1991335
- DOI: 10.1038/sj.gene.6364345
Gene expression profiling in a mouse model for African trypanosomiasis
Abstract
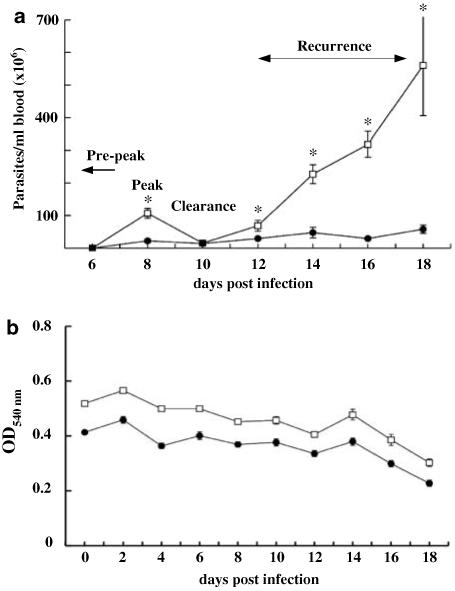
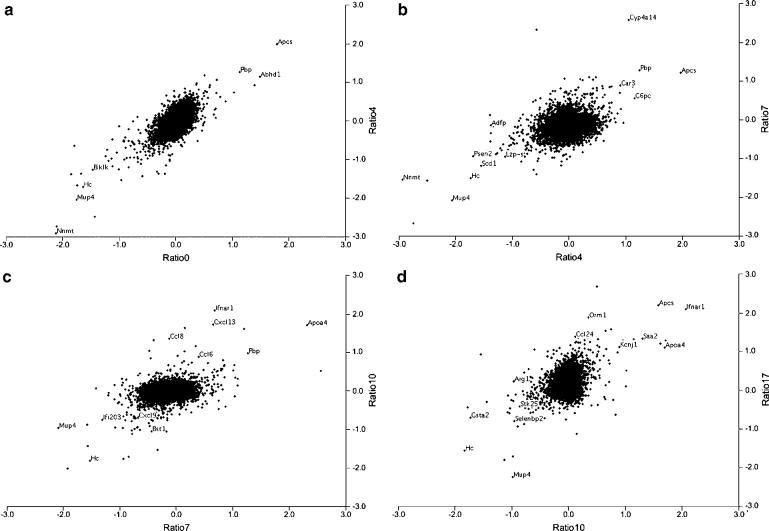
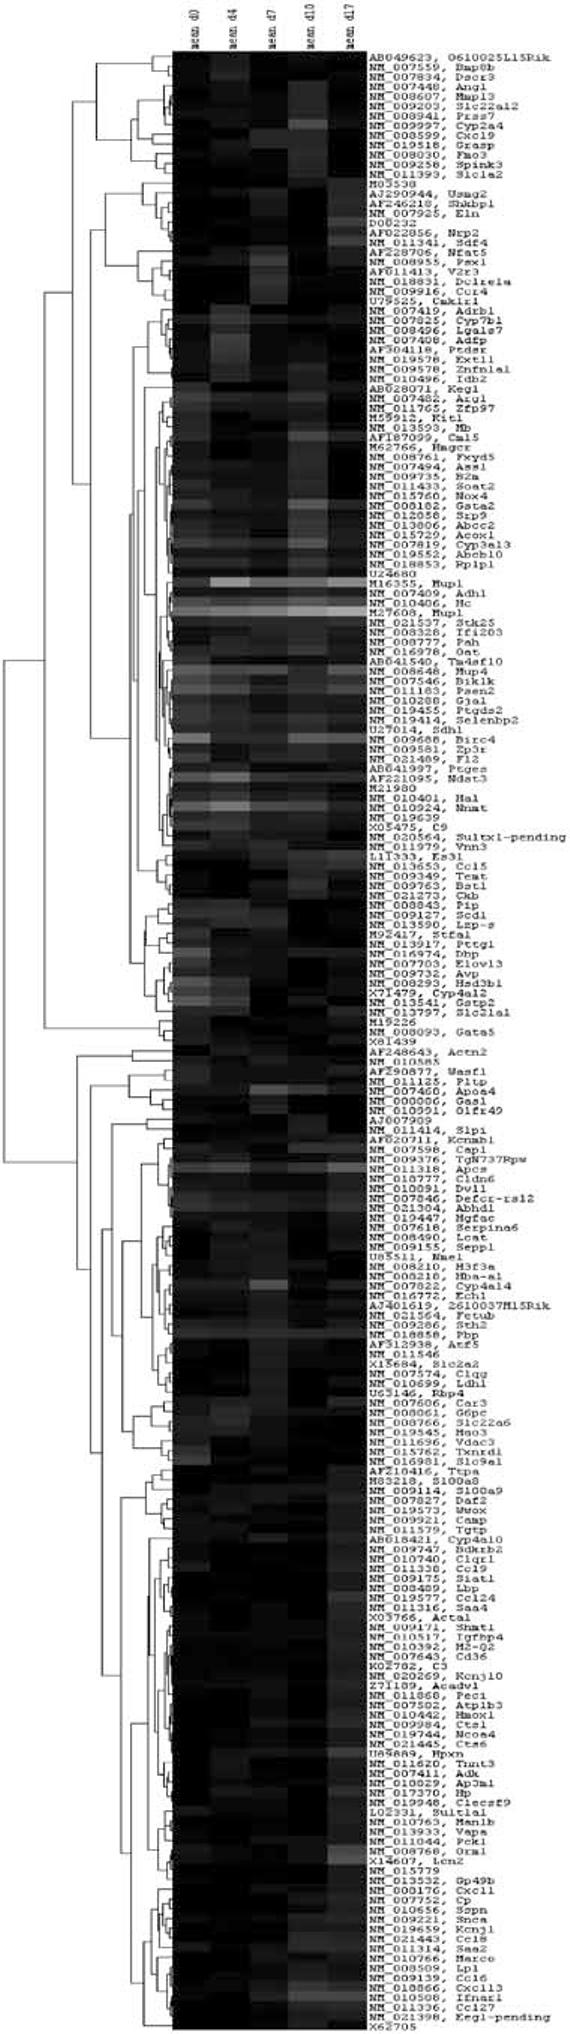
This study aimed to provide the foundation for an integrative approach to the identification of the mechanisms underlying the response to infection with Trypanosoma congolense, and to identify pathways that have previously been overlooked. We undertook a large-scale gene expression analysis study comparing susceptible A/J and more tolerant C57BL/6 mice. In an initial time course experiment, we monitored the development of parasitaemia and anaemia in every individual. Based on the kinetics of disease progression, we extracted total RNA from liver at days 0, 4, 7, 10 and 17 post infection and performed a microarray analysis. We identified 64 genes that were differentially expressed in the two strains in non-infected animals, of which nine genes remained largely unaffected by the disease. Gene expression profiling at stages of low, peak, clearance and recurrence of parasitaemia suggest that susceptibility is associated with high expression of genes coding for chemokines (e.g. Ccl24, Ccl27 and Cxcl13), complement components (C1q and C3) and interferon receptor alpha (Ifnar1). Additionally, susceptible A/J mice expressed higher levels of some potassium channel genes. In contrast, messenger RNA levels of a few immune response, metabolism and protease genes (e.g. Prss7 and Mmp13) were higher in the tolerant C57BL/6 strain as compared to A/J.
Figures

Similar articles
-
Mechanisms controlling anaemia in Trypanosoma congolense infected mice.PLoS One. 2009;4(4):e5170. doi: 10.1371/journal.pone.0005170. Epub 2009 Apr 13. PLoS One. 2009. PMID: 19365556 Free PMC article.
-
A comprehensive genetic analysis of candidate genes regulating response to Trypanosoma congolense infection in mice.PLoS Negl Trop Dis. 2010 Nov 9;4(11):e880. doi: 10.1371/journal.pntd.0000880. PLoS Negl Trop Dis. 2010. PMID: 21085469 Free PMC article.
-
Experimental murine Trypanosoma congolense infections. I. Administration of anti-IFN-gamma antibodies alters trypanosome-susceptible mice to a resistant-like phenotype.J Immunol. 1998 Nov 15;161(10):5507-15. J Immunol. 1998. PMID: 9820527
-
Bovine trypanotolerance: A natural ability to prevent severe anaemia and haemophagocytic syndrome?Int J Parasitol. 2006 May 1;36(5):521-8. doi: 10.1016/j.ijpara.2006.02.012. Epub 2006 Mar 13. Int J Parasitol. 2006. PMID: 16678182 Review.
-
Susceptibility and resistance to Trypanosoma congolense infections.Microbes Infect. 2000 Nov;2(13):1619-29. doi: 10.1016/s1286-4579(00)01318-6. Microbes Infect. 2000. PMID: 11113381 Review.
Cited by
-
Identification of Candidate Signature Genes and Key Regulators Associated With Trypanotolerance in the Sheko Breed.Front Genet. 2019 Nov 14;10:1095. doi: 10.3389/fgene.2019.01095. eCollection 2019. Front Genet. 2019. PMID: 31803229 Free PMC article.
-
Type I IFNs play a role in early resistance, but subsequent susceptibility, to the African trypanosomes.J Immunol. 2008 Oct 1;181(7):4908-17. doi: 10.4049/jimmunol.181.7.4908. J Immunol. 2008. PMID: 18802094 Free PMC article.
-
Mechanisms controlling anaemia in Trypanosoma congolense infected mice.PLoS One. 2009;4(4):e5170. doi: 10.1371/journal.pone.0005170. Epub 2009 Apr 13. PLoS One. 2009. PMID: 19365556 Free PMC article.
-
Computational Identification of Master Regulators Influencing Trypanotolerance in Cattle.Int J Mol Sci. 2021 Jan 8;22(2):562. doi: 10.3390/ijms22020562. Int J Mol Sci. 2021. PMID: 33429951 Free PMC article.
-
Role for parasite genetic diversity in differential host responses to Trypanosoma brucei infection.Infect Immun. 2010 Mar;78(3):1096-108. doi: 10.1128/IAI.00943-09. Epub 2010 Jan 19. Infect Immun. 2010. PMID: 20086091 Free PMC article.
References
-
- Torr SJ, Hargrove JW, Vale GA. Towards a rational policy for dealing with tsetse. Trends Parasitol. 2005;21:537–541. - PubMed
-
- Mansfield JM, Paulnock DM. Regulation of innate and acquired immunity in African trypanosomiasis. Parasite Immunol. 2005;27:361–371. - PubMed
-
- Omamo SW, d’Ieteren GD. Managing animal trypanosomosis in Africa: issues and options. Rev Sci Tech. 2003;22:989–1002. - PubMed
-
- Nyame AK, Kawar ZS, Cummings RD. Antigenic glycans in parasitic infections: implications for vaccines and diagnostics. Arch Biochem Biophys. 2004;426:182–200. - PubMed
-
- Hill EW, O’Gorman GM, Agaba M, Gibson JP, Hanotte O, Kemp SJ, et al. Understanding bovine trypanosomiasis and trypanotolerance: the promise of functional genomics. Vet Immunol Immunopathol. 2005;105:247–258. - PubMed
Publication types
MeSH terms
Grants and funding
LinkOut - more resources
Full Text Sources
Molecular Biology Databases
Miscellaneous
