

Mapping cortical thickness in children with 22q11.2 deletions
- PMID: 17056649
- PMCID: PMC2819929
- DOI: 10.1093/cercor/bhl097
Mapping cortical thickness in children with 22q11.2 deletions
Abstract
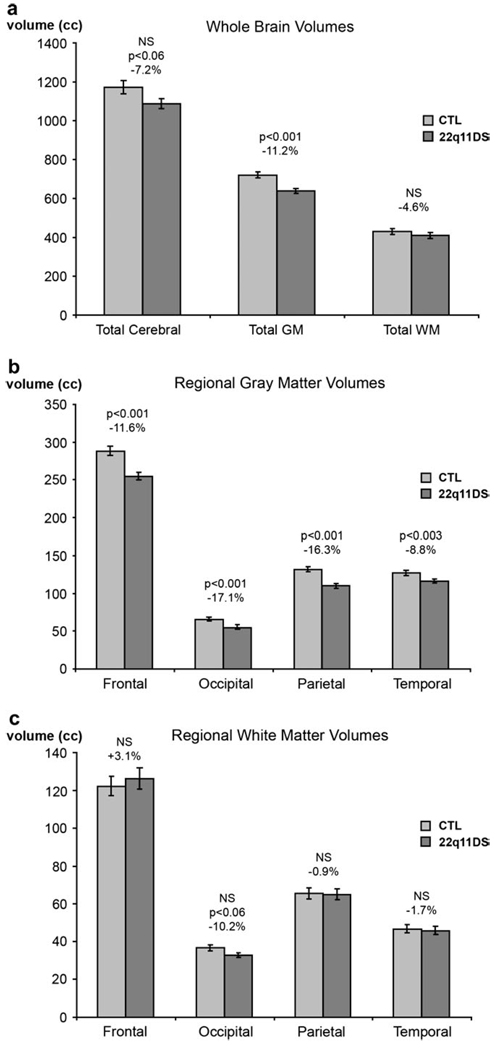
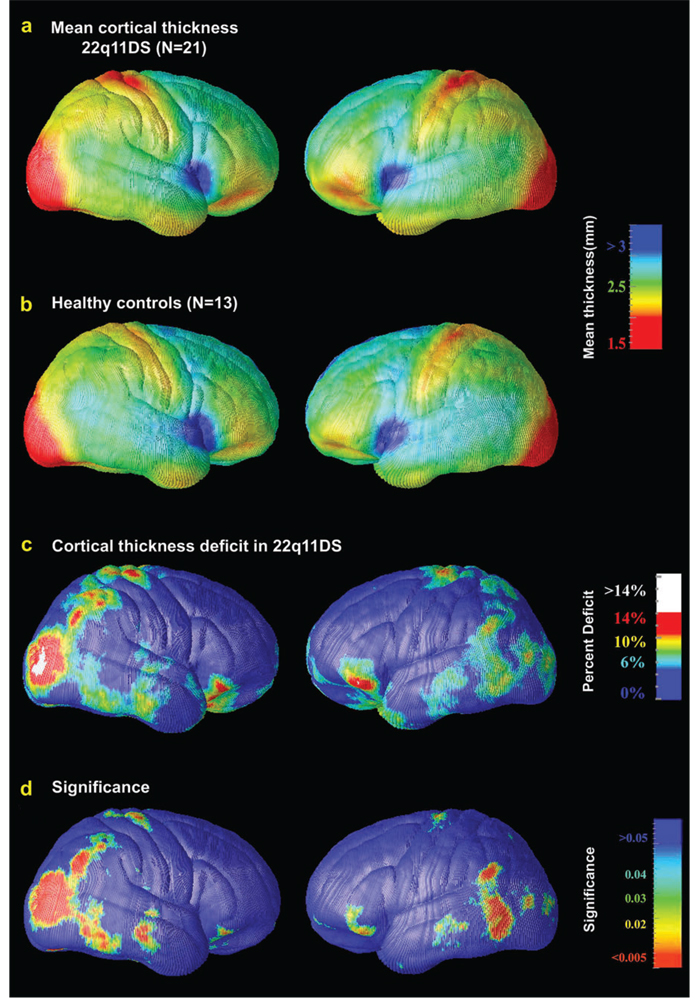
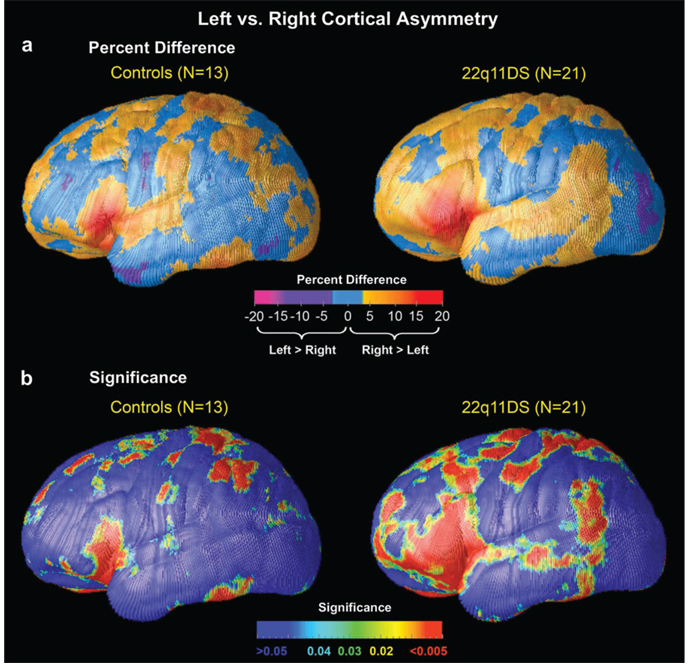
The 22q11.2 deletion syndrome (velocardiofacial/DiGeorge syndrome, 22q11.2DS) involves cardiac and craniofacial anomalies, marked deficits in visuospatial cognition, and elevated rates of psychosis. Although the mechanism is unknown, characteristic brain alterations may predispose to development of psychosis and cognitive deficits in 22q11DS. We applied cortical pattern matching and new methods for measuring cortical thickness in millimeters to structural magnetic resonance images of 21 children with confirmed 22q11.2 deletions and 13 demographically matched healthy comparison subjects. Thickness was mapped at 65 536 homologous points, based on 3-dimensional distance from the cortical gray-white matter interface to the external gray-cerebrospinal fluid boundary. A pattern of regionally specific cortical thinning was observed in superior parietal cortices and right parietooccipital cortex, regions critical for visuospatial processing, and bilaterally in the most inferior portion of the inferior frontal gyrus (pars orbitalis), a key area for language development. Several of the 30 genes encoded in the deleted segment are highly expressed in the developing brain and known to affect early neuronal migration. These brain maps reveal how haploinsufficiency for such genes can affect cortical development and suggest a possible underlying pathophysiology of the neurobehavioral phenotype.
Figures
Similar articles
-
Alterations in midline cortical thickness and gyrification patterns mapped in children with 22q11.2 deletions.Cereb Cortex. 2009 Jan;19(1):115-26. doi: 10.1093/cercor/bhn064. Epub 2008 May 14. Cereb Cortex. 2009. PMID: 18483006 Free PMC article.
-
[Neurocognitive and psychiatric management of the 22q11.2 deletion syndrome].Encephale. 2015 Jun;41(3):266-73. doi: 10.1016/j.encep.2014.10.005. Epub 2014 Dec 16. Encephale. 2015. PMID: 25523123 Review. French.
-
Regional brain abnormalities in 22q11.2 deletion syndrome: association with cognitive abilities and behavioral symptoms.Neurocase. 2004 Jun;10(3):198-206. doi: 10.1080/13554790490495519. Neurocase. 2004. PMID: 15788257
-
Genes, brain development and psychiatric phenotypes in velo-cardio-facial syndrome.Dev Disabil Res Rev. 2008;14(1):59-68. doi: 10.1002/ddrr.9. Dev Disabil Res Rev. 2008. PMID: 18636637 Review.
-
Abnormal cortical activation during response inhibition in 22q11.2 deletion syndrome.Hum Brain Mapp. 2007 Jun;28(6):533-42. doi: 10.1002/hbm.20405. Hum Brain Mapp. 2007. PMID: 17427209 Free PMC article.
Cited by
-
Bridging the gene-behavior divide through neuroimaging deletion syndromes: Velocardiofacial (22q11.2 Deletion) and Williams (7q11.23 Deletion) syndromes.Neuroimage. 2010 Nov 15;53(3):857-69. doi: 10.1016/j.neuroimage.2010.02.070. Epub 2010 Mar 3. Neuroimage. 2010. PMID: 20206275 Free PMC article. Review.
-
Measuring structural complexity in brain images.Neuroimage. 2008 Feb 15;39(4):1721-30. doi: 10.1016/j.neuroimage.2007.10.043. Epub 2007 Nov 12. Neuroimage. 2008. PMID: 18158255 Free PMC article.
-
Mapping genetic influences on ventricular structure in twins.Neuroimage. 2009 Feb 15;44(4):1312-23. doi: 10.1016/j.neuroimage.2008.10.036. Epub 2008 Nov 7. Neuroimage. 2009. PMID: 19041405 Free PMC article.
-
Functional significance of atypical cortical organization in spina bifida myelomeningocele: relations of cortical thickness and gyrification with IQ and fine motor dexterity.Cereb Cortex. 2013 Oct;23(10):2357-69. doi: 10.1093/cercor/bhs226. Epub 2012 Aug 8. Cereb Cortex. 2013. PMID: 22875857 Free PMC article.
-
Disrupted anatomic networks in the 22q11.2 deletion syndrome.Neuroimage Clin. 2016 Aug 25;12:420-8. doi: 10.1016/j.nicl.2016.08.020. eCollection 2016. Neuroimage Clin. 2016. PMID: 27622139 Free PMC article.
References
-
- Ballmaier M, Kumar A, Thompson P, Narr K, Lavretsky H, Estanol L, Deluca H, Toga AW. Localizing gray matter deficits in late-onset depression using computational cortical pattern matching methods. Am J Psychiatry. 2004;161(11):2091–2099. - PubMed
-
- Bearden CE, van Erp TG, Monterosso JR, Simon TJ, Glahn DC, Saleh PA, Hill NM, McDonald-McGinn DM, Zackai E, Emanuel BS, et al. Regional brain abnormalities in 22q11.2 deletion syndrome: association with cognitive abilities and behavioral symptoms. Neurocase. 2004;10(3):198–206. - PubMed
-
- Bearden CE, Wang PP, Simon TJ. Williams syndrome cognitive profile also characterizes velocardiofacial/DiGeorge syndrome. Am J Med Genet. 2002;114(6):689–692. - PubMed
-
- Bearden CE, Woodin MF, Wang PP, Moss E, McDonald-McGinn D, Zackai E, Emanuel B, Cannon TD. The neurocognitive phenotype of the 22q11.2 deletion syndrome: selective deficit in visual-spatial memory. J Clin Exp Neuropsychol. 2001;23(4):447–464. - PubMed
Publication types
MeSH terms
Grants and funding
- K23 MH074644/MH/NIMH NIH HHS/United States
- AG016570/AG/NIA NIH HHS/United States
- R21 RR019771/RR/NCRR NIH HHS/United States
- R01 LM005639/LM/NLM NIH HHS/United States
- EB01651/EB/NIBIB NIH HHS/United States
- R01 HD042974/HD/NICHD NIH HHS/United States
- RR019771/RR/NCRR NIH HHS/United States
- P50 AG016570/AG/NIA NIH HHS/United States
- K23MH074644-01/MH/NIMH NIH HHS/United States
- P41 RR013642/RR/NCRR NIH HHS/United States
- R01 CA039926-18/CA/NCI NIH HHS/United States
- LM05639/LM/NLM NIH HHS/United States
- R01 CA039926/CA/NCI NIH HHS/United States
LinkOut - more resources
Full Text Sources
Miscellaneous
