

Indirect readout: detection of optimized subsequences and calculation of relative binding affinities using different DNA elastic potentials
- PMID: 17038333
- PMCID: PMC1636474
- DOI: 10.1093/nar/gkl683
Indirect readout: detection of optimized subsequences and calculation of relative binding affinities using different DNA elastic potentials
Abstract
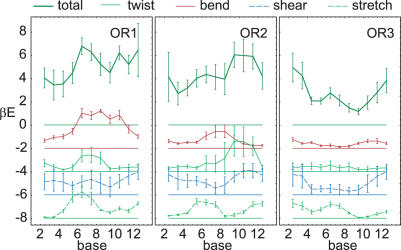
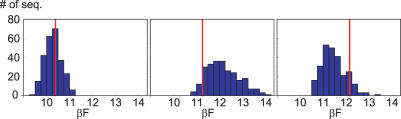
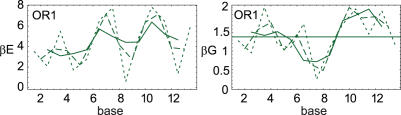
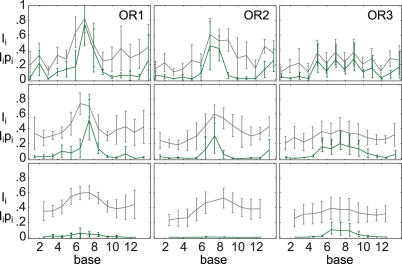
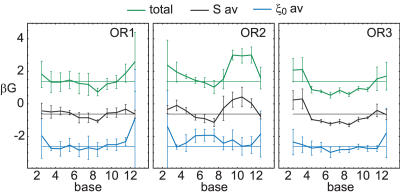
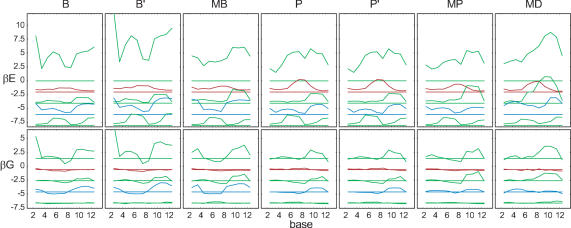
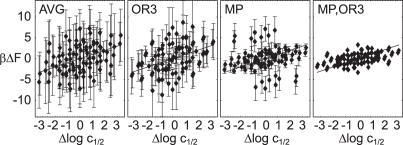
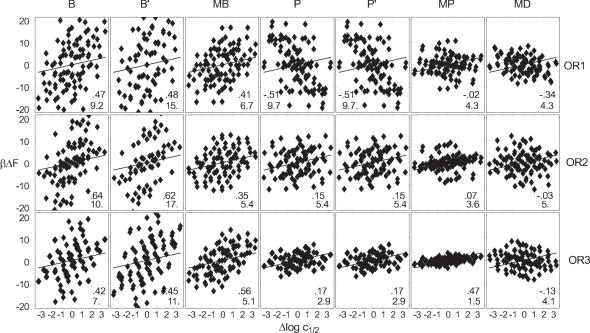
Essential biological processes require that proteins bind to a set of specific DNA sites with tuned relative affinities. We focus on the indirect readout mechanism and discuss its theoretical description in relation to the present understanding of DNA elasticity on the rigid base pair level. Combining existing parametrizations of elastic potentials for DNA, we derive elastic free energies directly related to competitive binding experiments, and propose a computationally inexpensive local marker for elastically optimized subsequences in protein-DNA co-crystals. We test our approach in an application to the bacteriophage 434 repressor. In agreement with known results we find that indirect readout dominates at the central, non-contacted bases of the binding site. Elastic optimization involves all deformation modes and is mainly due to the adapted equilibrium structure of the operator, while sequence-dependent elasticity plays a minor role. These qualitative observations are robust with respect to current parametrization uncertainties. Predictions for relative affinities mediated by indirect readout depend sensitively on the chosen parametrization. Their quantitative comparison with experimental data allows for a critical evaluation of DNA elastic potentials and of the correspondence between crystal and solution structures. The software written for the presented analysis is included as Supplementary Data.
Figures


Similar articles
-
Indirect readout of DNA sequence by p22 repressor: roles of DNA and protein functional groups in modulating DNA conformation.J Mol Biol. 2013 Jan 9;425(1):133-43. doi: 10.1016/j.jmb.2012.10.008. Epub 2012 Oct 17. J Mol Biol. 2013. PMID: 23085222
-
P22 c2 repressor-operator complex: mechanisms of direct and indirect readout.Biochemistry. 2008 Feb 26;47(8):2325-38. doi: 10.1021/bi701826f. Epub 2008 Feb 1. Biochemistry. 2008. PMID: 18237194
-
Specific minor groove solvation is a crucial determinant of DNA binding site recognition.Nucleic Acids Res. 2014 Dec 16;42(22):14053-9. doi: 10.1093/nar/gku1259. Epub 2014 Nov 27. Nucleic Acids Res. 2014. PMID: 25429976 Free PMC article.
-
Origins of specificity in protein-DNA recognition.Annu Rev Biochem. 2010;79:233-69. doi: 10.1146/annurev-biochem-060408-091030. Annu Rev Biochem. 2010. PMID: 20334529 Free PMC article. Review.
-
Specificity, free energy and information content in protein-DNA interactions.Trends Biochem Sci. 1998 Mar;23(3):109-13. doi: 10.1016/s0968-0004(98)01187-6. Trends Biochem Sci. 1998. PMID: 9581503 Review.
Cited by
-
Multiplexing Genetic and Nucleosome Positioning Codes: A Computational Approach.PLoS One. 2016 Jun 7;11(6):e0156905. doi: 10.1371/journal.pone.0156905. eCollection 2016. PLoS One. 2016. PMID: 27272176 Free PMC article.
-
Genomes of Multicellular Organisms Have Evolved to Attract Nucleosomes to Promoter Regions.Biophys J. 2017 Feb 7;112(3):505-511. doi: 10.1016/j.bpj.2016.12.041. Epub 2017 Jan 25. Biophys J. 2017. PMID: 28131316 Free PMC article.
-
Improved modeling of side-chain--base interactions and plasticity in protein--DNA interface design.J Mol Biol. 2012 Jun 8;419(3-4):255-74. doi: 10.1016/j.jmb.2012.03.005. Epub 2012 Mar 15. J Mol Biol. 2012. PMID: 22426128 Free PMC article.
-
Structure and mechanical properties of the ribosomal L1 stalk three-way junction.Nucleic Acids Res. 2012 Jul;40(13):6290-303. doi: 10.1093/nar/gks258. Epub 2012 Mar 26. Nucleic Acids Res. 2012. PMID: 22451682 Free PMC article.
-
Looping charged elastic rods: applications to protein-induced DNA loop formation.Eur Biophys J. 2011 Jan;40(1):69-80. doi: 10.1007/s00249-010-0628-5. Epub 2010 Oct 21. Eur Biophys J. 2011. PMID: 20963409
References
-
- Matthews B. Protein–DNA interaction. No code for recognition. Nature. 1988;335:294–295. - PubMed
-
- Suzuki M., Brenner S., Gerstein M., Yagi N. DNA recognition code of transcription factors. Protein Eng. 1995;8:319–328. - PubMed
-
- Pabo C., Nekludova L. Geometric analysis and comparison of protein-DNA interfaces: why is there no simple code for recognition? J. Mol. Biol. 2000;301:597–624. - PubMed
-
- Koudelka G., Harrison S., Ptashne M. Effect of non-contacted bases on the affinity of 434 operator for 434 repressor and Cro. Nature. 1987;326:886–888. - PubMed
-
- Koudelka G., Carlson P. DNA twisting and the effects of non-contacted bases on affinity of 434 operator for 434 repressor. Nature. 1992;355:89–91. - PubMed
