Comparative Study
. 2006 Dec;80(24):11968-81.
doi: 10.1128/JVI.01394-06. Epub 2006 Oct 4.

Gene structure and expression of Kaposi's sarcoma-associated herpesvirus ORF56, ORF57, ORF58, and ORF59

Affiliations
Comparative Study

Gene structure and expression of Kaposi's sarcoma-associated herpesvirus ORF56, ORF57, ORF58, and ORF59

Vladimir Majerciak et al. J Virol. 2006 Dec.

Abstract

Though similar to those of herpesvirus saimiri and Epstein-Barr virus (EBV), the Kaposi's sarcoma-associated herpesvirus (KSHV) genome features more splice genes and encodes many genes with bicistronic or polycistronic transcripts. In the present study, the gene structure and expression of KSHV ORF56 (primase), ORF57 (MTA), ORF58 (EBV BMRF2 homologue), and ORF59 (DNA polymerase processivity factor) were analyzed in butyrate-activated KSHV(+) JSC-1 cells. ORF56 was expressed at low abundance as a bicistronic ORF56/57 transcript that utilized the same intron, with two alternative branch points, as ORF57 for its RNA splicing. ORF56 was transcribed from two transcription start sites, nucleotides (nt) 78994 (minor) and 79075 (major), but selected the same poly(A) signal as ORF57 for RNA polyadenylation. The majority of ORF56 and ORF57 transcripts were cleaved at nt 83628, although other nearby cleavage sites were selectable. On the opposite strand of the viral genome, colinear ORF58 and ORF59 were transcribed from different transcription start sites, nt 95821 (major) or 95824 (minor) for ORF58 and nt 96790 (minor) or 96794 (major) for ORF59, but shared overlapping poly(A) signals at nt 94492 and 94488. Two cleavage sites, at nt 94477 and nt 94469, could be equally selected for ORF59 polyadenylation, but only the cleavage site at nt 94469 could be selected for ORF58 polyadenylation without disrupting the ORF58 stop codon immediately upstream. ORF58 was expressed in low abundance as a monocistronic transcript, with a long 5' untranslated region (UTR) but a short 3' UTR, whereas ORF59 was expressed in high abundance as a bicistronic transcript, with a short 5' UTR and a long 3' UTR similar to those of polycistronic ORF60 and ORF62. Both ORF56 and ORF59 are targets of ORF57 and were up-regulated significantly in the presence of ORF57, a posttranscriptional regulator.


Figures
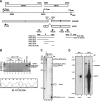
FIG. 1.
FIG. 1.
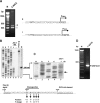
KSHV ORF56 is a split gene that produces transcripts of low abundance after lytic induction. (A) Schematic diagrams of the KSHV ORF56 and ORF57 ORFs and their transcripts. The numbers above each ORF are the nucleotide positions of the start and termination codons in the KSHV genome (GenBank accession number U75698) (33). The heavy line with dashes on both ends represents the genomic region encompassing ORF56 and ORF57, with promoters (arrows, designated by their transcription start sites) and 3′-end processing signals [a poly(A) signal and a cleavage site (CS)] indicated. Below the heavy line are bicistronic ORF56/57 and monocistronic ORF57 pre-mRNAs that each contain two exons (boxes 1 and 2) and one intron (dashes between boxes). Primers (heavy arrows) used to characterize KSHV ORF56 and ORF57 transcripts are shown below the pre-mRNAs and are named by the locations of their 5′ ends. Antisense RNA probes a and b for RPA assays and the resulting RNA products protected from each probe are illustrated in the bottom of the diagram, with the sizes (nt) in parentheses. (B) The majority of KSHV ORF56 transcripts are bicistronic ORF56/57 transcripts that are spliced to remove the ORF57 intron. The primers Pr81856 and Pr82296 were used in an RT-PCR on DNase I-treated total RNA (8 μg) isolated from uninduced (0 h) or n-butyrate (NB)-induced (24 and 48 h) JSC-1 cells. Parallel reactions without reverse transcriptase were used as a control. Twenty nanograms of Bac36 DNA (48) was used as a KSHV DNA control. The lower panel shows the splicing junction identified by sequencing of the 333-bp PCR product. (C) RPA analysis of ORF56 and ORF57 transcripts. Twenty micrograms of total RNA from uninduced or butyrate (NB)-induced JSC-1 cells was hybridized with 4 ng of antisense 32P-labeled probe a prepared by in vitro transcription. The protected products were separated along with 100-bp DNA ladders in an 8% denaturing polyacrylamide gel. Yeast total RNA (yRNA) was used as a negative RPA control. (D) Northern blot analysis of ORF56 and ORF57 transcripts. Approximately 1 μg of poly(A)-selected mRNA from uninduced (lane 1) or butyrate-induced (24 h) (lane 2) JSC-1 cells was used in Northern blot analysis with 32P-labeled antisense probe b prepared by in vitro transcription. The membrane was then exposed to X-ray film for various times. ?, unknown transcripts.
FIG. 2.
FIG. 2.
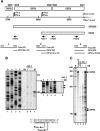
Splicing of the ORF56/57 intron is mediated through two alternative branch points. Primer extension was performed on 20 μg of total RNA from uninduced or butyrate (NB)-induced JSC-1 cells using a 32P-labeled antisense primer, Pr82296. (A) The sizes of the extended products, whether fully spliced products or splicing intermediates, were compared with the sequencing ladders obtained using the same primer on plasmid pVM1, which contains genomic ORF57 DNA. (B) The identified branch points (arrows pointing to the antisense sequence readout) and the branch point sequences (bolded and boxed) are shown to the right of an enlarged portion of the gel in panel A.
FIG. 3.
FIG. 3.
Mapping of the ORF56 transcription start site and cleavage sites for ORF56 and ORF57 polyadenylation. (A) Mapping of the ORF56 transcription start site. The 5′-RACE was conducted on total poly(A)+ mRNA isolated from butyrate-induced JSC-1 cells using an ORF56-specific primer, Pr79608. The sequences of RACE products I and II are shown to the right of the gel, where the start sites are indicated. (B) An RNase protection assay was performed on 20 μg of total RNA from uninduced or butyrate-induced JSC-1 cells with 4 ng of 32P-labeled antisense RNA probe b (see Fig. 1A) covering KSHV genome nt 83438 to 83705. The same PCR product was also cloned into the pCR2.1 vector (Invitrogen) and served as a template for sequencing with the 32P-labeled Pr83438 primer. The protected products were separated along with sequencing ladders and a 100-bp DNA ladder on an 8% denaturing polyacrylamide gel. (C) A portion of the gel in panel B, enlarged to show the protected products and the sequencing ladders. The arrow indicates a major protected product from butyrate-induced JSC-1 cells. The diagram shown below B and C contains the calculations of alternative cleavage site usage; regulatory elements upstream [a poly(A) signal] or downstream (a GU/U-rich element) of the cleavage site are also shown. (D) Mapping of ORF56/57 cleavage sites by 3′-RACE by using a primer, Pr83254 (see its position in Fig. 1A). An RACE product with the predicted size of ∼390 bp was detected, cloned, and sequenced.
FIG.4.
FIG.4.
Mapping of the KSHV ORF58 and ORF59 transcription start sites. (A) Schematic diagrams of KSHV ORF58 and ORF59 ORFs and their transcripts. See other details in Fig. 1A. The heavy line below ORF58 and ORF59 with dashes on both ends represents the genomic region encompassing ORF58 and ORF59, with the promoters (arrows, designated by their transcription start sites) and 3′ end processing signals [a poly(A) signal and a cleavage site (CS)] characterized in this study. Below the heavy line are the transcripts of bicistronic ORF58/59 and monocistronic ORF58. Primers (heavy arrows) used for primer extension, sequencing, or RACE are shown below the transcripts. Antisense RNA probes c, d, and e for RPA assays and the resulting RNA products protected from each probe are illustrated in the bottom of the diagram, with the sizes (nt) in parentheses. (B) Mapping of ORF58 transcription start sites by primer extension. Total RNA (20 μg) from uninduced or butyrate-induced JSC-1 cells was used for primer extension with a 32P-labeled primer, Pr95717. The same 32P-labeled primer was used to generate a sequencing ladder from a plasmid containing KSHV genomic DNA from nt 95717 to nt 96080. The extended products were compared with the sequencing ladder in an 8% denaturating polyacrylamide gel, and the corresponding sequence ladders to the extended products are the transcription start sites, as indicated by arrows shown at the bottom of the panel. (C) Mapping of ORF58 transcription start sites by RPA. RPA was performed on 20 μg of total RNA from uninduced or butyrate-induced JSC-1 cells, with 4 ng of 32P-labeled antisense RNA probe d. Arrows indicate the protected ORF58 or ORF59 transcripts. (D) Mapping of ORF58 and ORF59 transcription start sites by 5′-RACE with primer Pr95379. The left panel shows the products of 5′ RACE from regular extension (3 min) cycles. The right panel shows the products of 5′ RACE from short extension (30 s) cycles preferentially amplifying ORF58 transcripts. (E) Mapping of KSHV ORF59 transcription start site by primer extension. A primer extension assay was performed on 20 μg of total RNA from uninduced or butyrate-induced (24 h) JSC-1 cells with a 32P-labeled Pr96704 primer. The same primer was also used to generate a sequencing ladder from a plasmid containing KSHV genomic DNA from nt 97374 to 96704. The extended products were compared with the sequencing ladder in an 8% denaturating polyacrylamide gel, and the corresponding sequence ladders to the extended products are the transcription start sites as indicated by arrows shown at the bottom of the panel. (F) Mapping of ORF59 transcription start sites by RPA. RPA was performed on 25 μg of total RNA from uninduced or butyrate-induced JSC-1 cells with 4 ng of 32P-labeled RNA probe c (see panel A). Arrows indicate RPA products in sizes of 87 and 91 nt, respectively, just above its 1-nt-truncated product.
FIG.4.
FIG.4.
Mapping of the KSHV ORF58 and ORF59 transcription start sites. (A) Schematic diagrams of KSHV ORF58 and ORF59 ORFs and their transcripts. See other details in Fig. 1A. The heavy line below ORF58 and ORF59 with dashes on both ends represents the genomic region encompassing ORF58 and ORF59, with the promoters (arrows, designated by their transcription start sites) and 3′ end processing signals [a poly(A) signal and a cleavage site (CS)] characterized in this study. Below the heavy line are the transcripts of bicistronic ORF58/59 and monocistronic ORF58. Primers (heavy arrows) used for primer extension, sequencing, or RACE are shown below the transcripts. Antisense RNA probes c, d, and e for RPA assays and the resulting RNA products protected from each probe are illustrated in the bottom of the diagram, with the sizes (nt) in parentheses. (B) Mapping of ORF58 transcription start sites by primer extension. Total RNA (20 μg) from uninduced or butyrate-induced JSC-1 cells was used for primer extension with a 32P-labeled primer, Pr95717. The same 32P-labeled primer was used to generate a sequencing ladder from a plasmid containing KSHV genomic DNA from nt 95717 to nt 96080. The extended products were compared with the sequencing ladder in an 8% denaturating polyacrylamide gel, and the corresponding sequence ladders to the extended products are the transcription start sites, as indicated by arrows shown at the bottom of the panel. (C) Mapping of ORF58 transcription start sites by RPA. RPA was performed on 20 μg of total RNA from uninduced or butyrate-induced JSC-1 cells, with 4 ng of 32P-labeled antisense RNA probe d. Arrows indicate the protected ORF58 or ORF59 transcripts. (D) Mapping of ORF58 and ORF59 transcription start sites by 5′-RACE with primer Pr95379. The left panel shows the products of 5′ RACE from regular extension (3 min) cycles. The right panel shows the products of 5′ RACE from short extension (30 s) cycles preferentially amplifying ORF58 transcripts. (E) Mapping of KSHV ORF59 transcription start site by primer extension. A primer extension assay was performed on 20 μg of total RNA from uninduced or butyrate-induced (24 h) JSC-1 cells with a 32P-labeled Pr96704 primer. The same primer was also used to generate a sequencing ladder from a plasmid containing KSHV genomic DNA from nt 97374 to 96704. The extended products were compared with the sequencing ladder in an 8% denaturating polyacrylamide gel, and the corresponding sequence ladders to the extended products are the transcription start sites as indicated by arrows shown at the bottom of the panel. (F) Mapping of ORF59 transcription start sites by RPA. RPA was performed on 25 μg of total RNA from uninduced or butyrate-induced JSC-1 cells with 4 ng of 32P-labeled RNA probe c (see panel A). Arrows indicate RPA products in sizes of 87 and 91 nt, respectively, just above its 1-nt-truncated product.
FIG. 5.
FIG. 5.
Mapping of the KSHV ORF58 and ORF59 polyadenylation cleavage sites by RPA and 3′ RACE. (A) RPA was performed on 20 μg of total RNA from uninduced or butyrate-induced (24 h) JSC-1 cells with 4 ng of 32P-labeled RNA probe e (see Fig. 4A). The protected RNA products were then compared with a sequence ladder that was generated by the antisense primer Pr94768 from a plasmid containing KSHV genomic DNA from nt 94368 to 94768. The protected products were separated along with the sequencing ladders and a 100-bp DNA ladder in an 8% denaturating polyacrylamide gel. (B) Mapping of ORF58 and ORF59 cleavage sites by 3′ RACE by using a primer, Pr94768 (see its position in Fig. 4A). An RACE product with the predicted size of ∼320 bp was detected, cloned, and sequenced. (C) The sequence reading showing two alternative cleavage sites from the mappings, along with two alternative overlapping poly(A) signals upstream and one GU/U-rich element downstream of the cleavage site. The +10 position is relative to the first poly(A) signal, and the +14 position is relative to the second.
FIG. 6.
FIG. 6.
Transcription profiling of KSHV ORF58, ORF59, ORF60, ORF61, and ORF62 by Northern blotting. (A) Schematic diagram of predicted positions and transcription orientations of the ORFs from nt 94471 to 101194 in the KSHV genome. Dashes below the 6.7-kb transcript are individual ORF-specific probes used in this study. (B and C) Northern blot analysis. Approximate 1 μg of poly(A)+ mRNAs were isolated from uninduced (lane 1 in panel B and lanes 1, 3, 5, 7, and 9 in panel C) or butyrate-induced (lane 2 in panel B and lanes 2, 4, 6, 8, and 10 in panel C) JSC-1 cells, separated in a 1% formaldehyde-morpholinepropanesulfonic acid agarose gel, transferred onto a nylon membrane, fixed with UV light, and probed with 32P-labeled antisense probe e prepared by in vitro transcription (B) (see Fig. 4A) or a 32P-labeled oligonucleotide prepared by end labeling (C).
FIG. 7.
FIG. 7.
Enhancement of ORF56 expression by ORF57. (A) Detection of ORF56 transcripts by Northern blotting. Fractionated cytoplasmic (C) or nuclear (N) total RNA from 293 cells transfected with 1 μg of pVM9 (ORF56-FLAG) in the presence or absence of 0.2 μg of pVM7 (ORF57-FLAG) or pFLAG-CMV-5.1 control vector was prepared 24 h after transfection. Five micrograms of total RNA was used for Northern blot analysis with a 32P-labeled ORF56-specific probe. The same membrane was reprobed separately with a 32P-labeled GAPDH-specific probe and a U6-specific probe for sample loading and fractionation efficiency. The nuclear and cytoplasmic fractionation efficiencies were also verified by the presence or absence of 45S and 32S pre-rRNA. T, total RNA from unfractionated 293 cells. (B) Detection of ORF56-FLAG fusion protein by Western blot analysis. Protein samples were prepared after 24 h of transfection and blotted with anti-FLAG antibody to detect ORF56- and ORF57-FLAG fusions. The membrane was reprobed with anti-β-tubulin antibody for sample loading.

Similar articles

Cited by

References

    1. Bieleski, L., and S. J. Talbot. 2001. Kaposi's sarcoma-associated herpesvirus vCyclin open reading frame contains an internal ribosome entry site. J. Virol. 75:1864-1869. - PMC - PubMed
    1. Butler, J. E., and J. T. Kadonaga. 2002. The RNA polymerase II core promoter: a key component in the regulation of gene expression. Genes Dev. 16:2583-2592. - PubMed
    1. Cannon, J. S., D. Ciufo, A. L. Hawkins, C. A. Griffin, M. J. Borowitz, G. S. Hayward, and R. F. Ambinder. 2000. A new primary effusion lymphoma-derived cell line yields a highly infectious Kaposi's sarcoma herpesvirus-containing supernatant. J. Virol. 74:10187-10193. - PMC - PubMed
    1. Chan, S. R., and B. Chandran. 2000. Characterization of human herpesvirus 8 ORF59 protein (PF-8) and mapping of the processivity and viral DNA polymerase-interacting domains. J. Virol. 74:10920-10929. - PMC - PubMed
    1. Chen, Y., M. Ciustea, and R. P. Ricciardi. 2005. Processivity factor of KSHV contains a nuclear localization signal and binding domains for transporting viral DNA polymerase into the nucleus. Virology 340:183-191. - PubMed

Publication types