Comparative Study
. 2007 Feb 1;109(3):961-70.
doi: 10.1182/blood-2006-07-036640. Epub 2006 Sep 28.

Commonly dysregulated genes in murine APL cells

Affiliations
Comparative Study

Commonly dysregulated genes in murine APL cells

Wenlin Yuan et al. Blood. .

Abstract

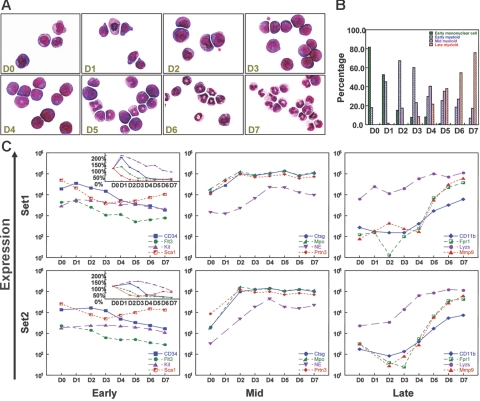
To identify genes that are commonly dysregulated in a murine model of acute promyelocytic leukemia (APL), we first defined gene expression patterns during normal murine myeloid development; serial gene expression profiling studies were performed with primary murine hematopoietic progenitors that were induced to undergo myeloid maturation in vitro with G-CSF. Many genes were reproducibly expressed in restricted developmental "windows," suggesting a structured hierarchy of expression that is relevant for the induction of developmental fates and/or differentiated cell functions. We compared the normal myeloid developmental transcriptome with that of APL cells derived from mice expressing PML-RARalpha under control of the murine cathepsin G locus. While many promyelocyte-specific genes were highly expressed in all APL samples, 116 genes were reproducibly dysregulated in many independent APL samples, including Fos, Jun, Egr1, Tnf, and Vcam1. However, this set of commonly dysregulated genes was expressed normally in preleukemic, early myeloid cells from the same mouse model, suggesting that dysregulation occurs as a "downstream" event during disease progression. These studies suggest that the genetic events that lead to APL progression may converge on common pathways that are important for leukemia pathogenesis.


Figures

Figure 1
Figure 1
G-CSF–driven myeloid differentiation from day 0 to day 7. (A) Morphology of G-CSF–treated cells from day 0 to day 7. Cytospins were made with cells harvested on days 0 to 7, and differentials were performed after May-Grunwald-Giemsa staining. (Sigma, St. Louis, MO). Cells were visualized using a Nikon Microphot-SA microscope (Nikon, Tokyo, Japan) with a 100×/1.40 oil objective. Images were captured using a Colorview II camera (Soft Imaging System, Lakewood, CO), and images were produced with analySIS software (Soft Imaging System). The images were not edited. (B) Differential counts for early mononuclear cells, early myeloid cells (promyelocytes), mid myeloid cells (myelocytes and metamyelocytes), and late myeloid cells (bands and neutrophils) from day 0 to day 7. Two hundred cell differentials were performed for each day. (C) Changes in the expression of known early, mid, and late myeloid genes during G-CSF–driven myeloid differentiation in 2 independent gene expression analyses (set 1 and set 2). “Early” genes include CD34, fms-related tyrosine kinase 3 (Flt3), Kit, and Sca1; “mid” genes include cathepsin G (Ctsg), myeloperoxidase (Mpo), neutrophil elastase (Ela2), and proteinase 3 (Prtn3); “late” genes include CD11b (Itgam), formyl peptide receptor 1 (Fpr1), lysozyme (Lyzs), and Mmp9. Signal intensity values (normalized to whole array target intensity of 1500 for all probe sets) are displayed on the y-axis. The inset in the “early” panel displays expression values on a linear scale instead of a log scale.
Figure 2
Figure 2
Microarray analysis of myeloid differentiation. (A) Heat map of the 27 127 “expressed” probe sets (with MAS 5 “present” call and > 150 signal units for at least one day) in experimental set 1, normalized to the percentage of the maximal value of each probe set from days 0 to 7. (B) Definition of the most highly expressed probe sets on each day of differentiation (100 for each day) chosen by z-score analysis. A heat map displaying z-score values for each of the selected probe sets on all days of differentiation are shown. (C) The top 100 probe sets for each day (as displayed in B) were replotted with the data from experimental set 2. Day-1 data were not available for this set. (D) Graphic representation of the absolute signal values from the top 100 probe sets on each day of myeloid differentiation from set 1, as defined in panel B. (E) Biological process classification of the genes shown in panel B.
Figure 3
Figure 3
The expression phenotype of murine APL cells. (A) Unsupervised hierarchic clustering analysis of RNA array data (32 420 probe sets) from the spleens and bone marrows of 4 independent mCG-PML-RARα mice with APL, 4 normal murine bone marrow samples, and 2 normal murine spleen samples. Expression data on the heat map are displayed as z-scores. (B) Expression levels of 12 genes associated with early, mid, and late myeloid differentiation (during murine G-CSF–induced differentiation, days 0-1: blue bars; days 2-3: pink bars; days 4-7: blue-green bars), and in 6 murine APL samples (red indicates averages for 6 samples; brackets, SEMs). (Inset) Expression levels of PU.1 on an expanded scale. (C) Heat map of expression data from set 1, and 6 independent APL samples. Probe sets (4244) with expression values peaking on day 2 were selected for analysis. Expression is shown as a ratio of each sample to the reference sample (day 2). Data from the same differentiation experiment (set 1) were displayed in panels B-C.
Figure 4
Figure 4
A subset of genes is dysregulated in most murine APL samples. Expression profiles from GeneChip analyses designed to identify genes that were dysregulated in APL leukemic cells when compared with G-CSF–differentiated normal myeloid cells. APL expression was compared with 3 time points in the differentiation assay to capture the least and most differentiated myeloid cells (day 0, day 7) and the time point most enriched for promyelocytes (day 2). See “Materials and methods” for the algorithms used for each analysis (sets A-D). Heat maps show gene expression as a ratio of each sample to the reference sample in a continuous color range (green to red) of 0 to 1 (A, day 0; B, day 7; C, day 2; D, average of 6 APL samples). The same differentiation experiment (from set 1) is shown in each heat map. (A) Nineteen genes were highly expressed on day 0 and in APL cells, and had much lower expression on days 1 to 7 (set A). (B) Twenty-nine genes were highly expressed on day 7 and in APL cells, and had much lower expression on days 0 to 6 (set B). (C) Thirty-six genes were maximally expressed on day 2, had much lower expression on the other days, and in APL had less than 0.2 times the expression on day 2 (set C). (D) Thirty-two genes were highly expressed in APL cells and had much lower expression on day 2 (set D).
Figure 5
Figure 5
Organization of dysregulated genes into common pathways. (A) One-hundred-and-sixteen dysregulated genes (sets A-D) were analyzed in PathwayArchitect (Stratagene) to determine a relevance interaction network. Thirty-one genes with a high confidence index of interactions were included in the pathway layout graph. Connecting lines between gene symbols indicate interactions; different types of interactions are denoted by symbols on the lines. Green square indicates regulation; purple square, binding; blue square, expression; orange circle, protein modification; red diamond, metabolism; green circle, promoter binding; yellow triangle, transport; + in gray circle, positive effect; and − in gray circle, negative effect. (B) GO annotations of the murine APL dysregulome genes. Red indicates genes with increased expression in APL cells with respect to enriched promyelocytes; green, genes with decreased expression. (C) Two grouping variable category graphs show raw probe set signal intensity values for the common pathway genes shown in panel A (and also Gapdh) for days 0 to 7 of the myeloid differentiation assay, and for 6 APL samples.
Figure 6
Figure 6
Common pathway gene expression patterns in leukemic and nonleukemic hematopoietic tissues. (A) qRT-PCR analysis of Fos, Jun, Egr-1, Tnf, and Vcam1 expression levels was performed using primers specific for each cDNA. All data were normalized to Gapdh, since the expression of this gene does not change during myeloid differentiation (Figure 5C). Day-2 samples were obtained from 2 independent myeloid differentiation experiments. The 6 APL samples used were the same as those used in the studies shown in Figures 4–5. All RNA samples used for this study were nonamplified. (B-F) Common pathway gene expression patterns in whole bone marrow and spleen samples using nonamplified RNA- and array-based expression profiling. Two grouping variable category graphs show raw probe set signal intensity values for the common pathway genes identified in Figure 5. Unmanipulated bone marrow and spleen samples were obtained from either wild-type mice (WT), or from mCG-PML-RARα mice (KI), and were cryopreserved prior to analysis. APL samples were obtained from the cryopreserved spleens of 18 overtly leukemic mCG-PML-RARα mice, including the 6 APL samples in Figures 3C, 4, and 5 (Table S2, APL samples 1-18).
Figure 7
Figure 7
Expression patterns of common pathway genes in preleukemic early myeloid cells. Two grouping variable category graphs display raw signal intensity values for the common pathway genes, and for several abundantly expressed azurophil granule genes. Myeloid differentiation studies were performed as shown in Figure 1. Two independent pools of wild-type mice and 2 independent pools of mCG-PML-RARα mice were used in the study. Cells were harvested on days 0 and 2 of differentiation, and array-based expression analysis was performed. The data for the common pathway genes are representative of nearly all genes in the APL dysregulome.

Similar articles

Cited by

References

    1. Debernardi S, Lillington DM, Chaplin T, et al. Genome-wide analysis of acute myeloid leukemia with normal karyotype reveals a unique pattern of homeobox gene expression distinct from those with translocation-mediated fusion events. Genes Chromosomes Cancer. 2003;37:149–158. - PubMed
    1. Kohlmann A, Schoch C, Schnittger S, et al. Molecular characterization of acute leukemias by use of microarray technology. Genes Chromosomes Cancer. 2003;37:396–405. - PubMed
    1. Bullinger L, Döhner K, Bair E, et al. Use of gene-expression profiling to identify prognostic subclasses in adult acute myeloid leukemia. N Engl J Med. 2004;350:1605–1616. - PubMed
    1. Staber PB, Linkesch W, Zauner D, et al. Common alterations in gene expression and increased proliferation in recurrent acute myeloid leukemia. Oncogene. 2004;23:894–904. - PubMed
    1. Valk PJM, Verhaak RGW, Beijen MA, et al. Prognostically useful gene-expression profiles in acute myeloid leukemia. N Engl J Med. 2004;350:1617–1628. - PubMed

Publication types

MeSH terms

Substances