Human immunodeficiency virus persistence and production in T-cell development
- PMID: 16988009
- PMCID: PMC1656539
- DOI: 10.1128/CVI.00184-06
Human immunodeficiency virus persistence and production in T-cell development
Abstract
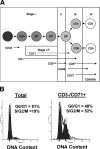
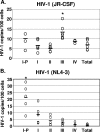
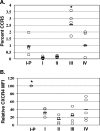
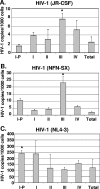
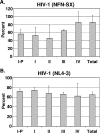
Human immunodeficiency virus type 1 (HIV-1) replication depends on CD4 and coreceptor expression as well as host factors associated with the activation state of the cell. To determine the impact of the activation stage of thymocytes on the HIV-1 life cycle, we investigated R5 and X4 HIV-1 entry, reverse transcription, and expression in discrete thymocyte subsets at different stages of T-cell development. Early after infection, preferential entry and replication of R5 HIV-1 were predominantly detected in mature CD3(+/hi) CD27(+) thymocytes. Thus, R5 HIV-1 targets the stage of development where thymocytes acquire functional responsiveness, which has important implications for HIV pathogenesis. In contrast, X4 HIV-1 expression and replication were primarily found in immature CD3(-/+/low) CD27(-) CD69(-) thymocytes. HIV-1 proviral burden and virus expression in thymocyte subsets correlated with the expression of the highest levels of the respective coreceptor. R5 and X4 HIV-1 entered and completed reverse transcription in all subsets tested, indicating that the activation state of thymocytes and coreceptor expression are sufficient to support full reverse transcription throughout development. Although R5 HIV-1 is expressed mainly in mature CD3(+/hi) CD27(+) thymocytes, 5.3% of HIV-1-infected immature thymocytes express R5 HIV-1, indicating that potentially latent viral DNA can be established early in T-cell development.
Figures

Similar articles
-
Inhibition of CD3/CD28-mediated activation of the MEK/ERK signaling pathway represses replication of X4 but not R5 human immunodeficiency virus type 1 in peripheral blood CD4(+) T lymphocytes.J Virol. 2000 Mar;74(6):2558-66. doi: 10.1128/jvi.74.6.2558-2566.2000. J Virol. 2000. PMID: 10684270 Free PMC article.
-
Impact of cytokines on replication in the thymus of primary human immunodeficiency virus type 1 isolates from infants.J Virol. 2002 Jul;76(14):6929-43. doi: 10.1128/jvi.76.14.6929-6943.2002. J Virol. 2002. PMID: 12072494 Free PMC article.
-
Positive regulation of CXCR4 expression and signaling by interleukin-7 in CD4+ mature thymocytes correlates with their capacity to favor human immunodeficiency X4 virus replication.J Virol. 2003 May;77(10):5784-93. doi: 10.1128/jvi.77.10.5784-5793.2003. J Virol. 2003. PMID: 12719571 Free PMC article.
-
The macrophage response to HIV-1: Intracellular control of X4 virus replication accompanied by activation of chemokine and cytokine synthesis.J Neurovirol. 2002 Dec;8(6):599-610. doi: 10.1080/13550280290100923. J Neurovirol. 2002. PMID: 12476353 Review.
-
The role of the cell cycle in HIV-1 infection.Adv Exp Med Biol. 1995;374:27-31. doi: 10.1007/978-1-4615-1995-9_3. Adv Exp Med Biol. 1995. PMID: 7572398 Review.
Cited by
-
CD31, a Valuable Marker to Identify Early and Late Stages of T Cell Differentiation in the Human Thymus.J Immunol. 2017 Mar 15;198(6):2310-2319. doi: 10.4049/jimmunol.1500350. Epub 2017 Feb 3. J Immunol. 2017. PMID: 28159903 Free PMC article.
-
Thymic HIV-2 infection uncovers posttranscriptional control of viral replication in human thymocytes.J Virol. 2015 Feb;89(4):2201-8. doi: 10.1128/JVI.03047-14. Epub 2014 Dec 3. J Virol. 2015. PMID: 25473058 Free PMC article.
-
Histoarchitectural Deterioration of Lymphoid Tissues in HIV-1 Infection and in Aging.AIDS Res Hum Retroviruses. 2019 Nov/Dec;35(11-12):1148-1159. doi: 10.1089/AID.2019.0156. Epub 2019 Oct 7. AIDS Res Hum Retroviruses. 2019. PMID: 31474115 Free PMC article. Review.
-
A Novel HIV-1 Nef Mutation in a Primary Pediatric Isolate Impairs MHC-Class I Downregulation and Cytopathicity.AIDS Res Hum Retroviruses. 2020 Feb;36(2):122-130. doi: 10.1089/AID.2019.0160. Epub 2019 Nov 4. AIDS Res Hum Retroviruses. 2020. PMID: 31571497 Free PMC article.
-
Sphingosine-1-phosphate/sphingosine-1-phosphate receptor 1 signaling is required for migration of naive human T cells from the thymus to the periphery.J Allergy Clin Immunol. 2016 Aug;138(2):551-557.e8. doi: 10.1016/j.jaci.2015.12.1339. Epub 2016 Apr 4. J Allergy Clin Immunol. 2016. PMID: 27056271 Free PMC article.
References
-
- Aldrovandi, G. M., G. Feuer, L. Gao, B. Jamieson, M. Kristeva, I. S. Y. Chen, and J. A. Zack. 1993. The SCID-hu mouse as a model for HIV-1 infection. Nature 363:732-736. - PubMed
-
- Baba, M., O. Nishimura, N. Kanzaki, M. Okamoto, H. Sawada, Y. Iizawa, M. Shiraishi, Y. Aramaki, K. Okonogi, Y. Ogawa, K. Meguro, and M. Fujino. 1999. A small-molecule, nonpeptide CCR5 antagonist with highly potent and selective anti-HIV-1 activity. Proc. Natl. Acad. Sci. USA 96:5698-5703. - PMC - PubMed
-
- Bakri, Y., C. Schiffer, V. Zennou, P. Charneau, E. Kahn, A. Benjouad, J. C. Gluckman, and B. Canque. 2001. The maturation of dendritic cells results in postintegration inhibition of HIV-1 replication. J. Immunol. 166:3780-3788. - PubMed
-
- Berkowitz, R. D., S. Alexander, C. Bare, V. Linquist-Stepps, M. Bogan, M. E. Moreno, L. Gibson, E. D. Wieder, J. Kosek, C. A. Stoddart, and J. M. McCune. 1998. CCR5- and CXCR4-utilizing strains of human immunodeficiency virus type 1 exhibit differential tropism and pathogenesis in vivo. J. Virol. 72:10108-10117. - PMC - PubMed
Publication types
MeSH terms
Grants and funding
LinkOut - more resources
Full Text Sources
Research Materials

