. 2006 Sep;8(9):733-46.
doi: 10.1593/neo.06274.

Molecular cross-talk between the NFkappaB and STAT3 signaling pathways in head and neck squamous cell carcinoma

Affiliations

Molecular cross-talk between the NFkappaB and STAT3 signaling pathways in head and neck squamous cell carcinoma

Cristiane H Squarize et al. Neoplasia. 2006 Sep.

Abstract

The development of head and neck squamous cell carcinoma (HNSCC) involves the accumulation of genetic and epigenetic alterations in tumor-suppressor proteins, together with the persistent activation of growth-promoting signaling pathways. The activation of epidermal growth factor receptor (EGFR) is a frequent event in HNSCC. However, EGFR-independent mechanisms also contribute to the activation of key intracellular signaling routes, including signal transducer and activator of transcription-3 (STAT3), nuclear factor kappaB (NFkappaB), and Akt. Indeed, the autocrine activation of the gp130 cytokine receptor in HNSCC cells by tumor-released cytokines, such as IL-6, can result in the EGFR-independent activation of STAT3. In this study, we explored the nature of the molecular mechanism underlying enhanced IL-6 secretion in HNSCC cells. We found that HNSCC cells display an increased activity of the IL-6 promoter, which is dependent on the presence of an intact NFkappaB site. Furthermore, NFkappaB inhibition downregulated IL-6 gene and protein expression, and decreased the release of multiple cytokines. Interestingly, interfering with NFkappaB function also prevented the autocrine/paracrine activation of STAT3 in HNSCC cells. These findings demonstrate a cross-talk between the NFkappaB and the STAT3 signaling systems, and support the emerging notion that HNSCC results from the aberrant activity of a signaling network.


Figures
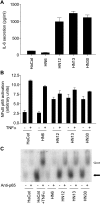
Figure 1
Figure 1
HNSCC cells secrete IL-6 and exhibit enhanced NFκB DNA-binding activity. (A) IL-6 levels in CM from the indicated cell lines were measured and presented as bar graphs. Limited amounts of IL-6 were produced and secreted by HaCaT and HN6; in contrast, high levels were detected in CM from the HN12, HN13, and HN30 cell lines. The data are presented as the mean ± SE of triplicate measurements. (B) Levels of activated NFκB contained in nuclear extracts were assessed by their ability to bind to a consensus NFκB-binding site oligonucleotide, and an NFκB-DNA binding complex was revealed by chemiluminescence on incubation with antip65 antiserum followed by a secondary antibody conjugated to HRP. Bar graphs represent the mean ± SE of quantitative measurements of NFκB in arbitrary units, which were high in HN12, HN13, and HN30, but not in HaCaT and HN6, under normal culture conditions. Cell lines were also stimulated with TNF-α (10 ng/ml for 10 minutes), which stimulates NFκB activation. HaCaT cells served as positive control. Data are presented as the mean ± SE of triplicate measurements. (C) EMSA was performed using a 32P-labeled consensus oligonucleotide containing the sequence for NFκB-binding sites. Nuclear extracts were harvested from each cell line. Bands (black arrow) represent shifted protein-DNA complexes, which are found in HN12, HN13, and HN30, but not in HaCaT and HN6, under regular culture conditions. HaCaT was also stimulated with TNF-α as a control, thus confirming the binding and shifting of protein-DNA complexes. Preincubation of nuclear extracts with anti-NFκB (p65) resulted in the appearance of a slower migrating (supershifted) band (open arrow), confirming the presence of active NFκB in protein-DNA complexes.
Figure 2
Figure 2
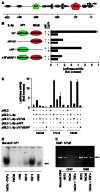
Enhanced activity of the IL-6 promoter in HNSCC. A key role for NFκB. (A) Graphic representation of the human IL-6 promoter (IL-6p) and its regulatory elements depicting their approximate locations relative to the transcription start site (+1). This promoter region includes response elements for the NFκB, AP1, and helix-loop-helix transcription factors, multiple responsive element, a cAMP-responsive element, and glucocorticoid-responsive element. (B) Site-direct mutations within the IL-6 promoter. Full-length IL-6p WT and site-direct mutations within the NFκB (ΔNFκB) and ΔAP1 (DAP1) sites were inserted into the luciferase vector (pGL3-Luc). Sequences of NFκB (red circle) and AP1 (green circle) transcriptional factor-binding sites and their point mutants (capital letters) are indicated. Full-length IL-6p WT and its mutants (0.1 µg) were transiently transfected into HEK293T cells with p65 (1 µg) and the pRL-null construct (0.01 µg), and were cultured in serum-free conditions. Dual-luciferase activity was determined, as described in Materials and Methods section. Data were presented as firefly luciferase activity normalized by the Renilla luciferase activity present in each sample, expressed as fold increase relative to control. Values plotted are the average ± SE of triplicate samples from a typical experiment. (C) The HNSCC cell lines HN13 and HN30, and immortalized keratinocytes (HaCaT) were transiently transfected with pGL3-Luc, pGL3 IL-6p WT and pGL3 IL-6p-ΔNFκB, and pGL3 IL-6p-ΔAP1 (0.3 µg), along with the pRL-null construct (0.01 µg), and cultured in serum-free conditions. Data are presented as firefly luciferase activity normalized by the Renilla luciferase activity present in each sample, expressed as fold increase relative to the vector reporter control (pGL3-Luc). Values plotted were the average ± SE of triplicate samples from a typical experiment that was repeated three to five times with nearly identical results. (D) AP1 activity in HNSCC. EMSA was performed using a 32P-labeled consensus oligonucleotide containing the sequence for AP1-binding sites. Nuclear extracts were harvested from serum-deprived cells. Bands (black arrow) represent shifted protein-DNA complexes, which are highly active only in HN13 under regular culture conditions. HaCaT was also stimulated with TNF-α as a control. (E) In vivo binding of endogenous NFκB to the IL-6 promoter. Chromatin proteins were cross-linked to DNA by formaldehyde, and purified nucleoprotein complexes were immunoprecipitated by anti-NFκB p65 antibody. The precipitated DNA and total nuclear extracts were analyzed by PCR for the presence of NFκB IL-6 promoter region corresponding to a fragment of 217 bp (arrow), which was revealed by staining agarose gels with ethidium bromide. Genomic DNA and TNF-α-stimulated HaCaT were used as a positive control confirming the binding of NFκB to the IL-6 promoter in vivo.
Figure 3
Figure 3
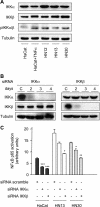
The role of IKKα and IKβK in NFκB regulation in HNSCC cells. Serum-starved cell lines were immunoblotted with anti-IKKα, IKKβ, and phospho-IKKα/β antibodies. Tubulin was used as a loading control (A and B). (A) HaCaT, HN12, HN13, and HN30 immunoblot analysis shows the level of expression of IKKα and IKKβ. Elevated levels of active phospho-IKKα/β in HN12, HN13, and HN30 cells were detected under basal conditions, using TNF-α-stimulated HaCaT cells as positive control. (B) A time-course analysis was performed to assess the effective and selective knockdown of IKKα and IKKβ on transfection with their corresponding siRNA. Representative Western blot analyses depict the expression levels of IKKα/β and tubulin as loading controls in each cellular lysate. Negative siRNA oligonucleotides were used as control (C). (C) Nuclear extracts from HaCaT, HN13, and HN30, with the use of indicated siRNA, were assayed for activated NFκB levels, as assessed by their ability to bind to a consensus NFκB-binding site oligonucleotide, and an NFκB-DNA binding complex was revealed by chemiluminescence on incubation with anti-p65 antiserum followed by a secondary antibody conjugated to HRP. Bar graphs represent the mean ± SE of quantitative measurements of NFκB in arbitrary units. Asterisks denote a significant inhibition of NFκB activity by each specific siRNA interference (*P < .05, **P < .01, and ***P < .001; analysis of variance and Bonferroni's multiple comparison test).
Figure 4
Figure 4
Inhibition of NFκB decreases the activity of the IL-6 promoter. HaCaT (A and B) and HNSCC cell lines HN13 (C) and HN30 (D) were transiently transfected with pNFκB-Luc (0.3 µg) (A; □ in C and D), pIL-6p-Luc (0.3 µg) (B; ■ in C and D), the pRL-null construct (0.01 µg), and increased concentrations of pCEFL IκB S32/36A, and cultured in serum-free conditions. The total amount of plasmid DNA was adjusted to 1 µg with pcDNA3-β-galactosidase. HaCaT was stimulated with TNF-α (10 ng/ml for 10 min), where indicated (A). Lysates were assayed for dual-luciferase activities. Data were presented as firefly luciferase activity normalized by the Renilla luciferase activity present in each sample, expressed as fold increase relative to control with only pcDNA3-β-galactosidase (A and B) or as percentage (C and D) of the activity without NFκB inhibition bypCEFL IκB S32/36A. Values plotted were the average ± SE of triplicate samples from typical experiments, which were repeated at least three to five times with nearly identical results.
Figure 5
Figure 5
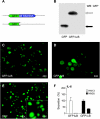
IL-6 production and secretion are dependent on NFκB activation. Lentiviral vectors were engineered for GFP and the full-length IκB harboring a substitution of Ser32 and Ser36 for alanine (A, top), which acts as an NFκB super repressor by blocking IκB proteolysis, tagged with a GFP-IκB. The expression levels of GFP-IκB (B, empty arrow) and GFP (B, black arrow) in HaCaT cells 72 hours after infection with these lentiviruses were documented by immunoblotting with anti-GFP antibody. Similar results were observed in the HNSCC cell lines HN13 and HN30. GFP-IκB (C and D) and GFP (E) were visualized in vivo in HN13 cells, as well as in HaCaT and HN30 cells (not shown), by fluorescence microscopy at the indicated magnification. High magnification (original magnification, x 63) revealed a cytoplasmatic expression of GFP-IκB (D) and a mostly nuclear expression of GFP (E, inset). After serum starvation, CM from the HNSCC cell lines were analyzed for IL-6 (F). Data were presented as a percentage of IL-6 secreted in GFP-IκB-expressing cells with respect to GFP-infected controls. Values plotted were the average ± SE of triplicate samples.
Figure 6
Figure 6
NFκB-dependent production and secretion of multiple cytokines in HNSCC cells. CM from the HNSCC cell lines HN13 and HN30 stably expressing IκB S32/36A (GFP-IκB) and GFP were analyzed for the secretion of IL-2, IL-8, IL-10, IL-12, G-CSF, and GM-CSF using a proteomic array. Bar graphs represent the quantitative measurement of proteins secreted in the CM. Values plotted were the average ± SE of triplicate samples.
Figure 7
Figure 7
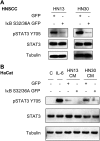
Blockade of NFκB inhibits the autocrine/paracrine activation of STAT3. The HaCaT and HNSCC cell lines HN13 and HN30 were immunoblotted with anti-pSTAT3Y705 antibody and anti-STAT3. Tubulin was used as a loading control. (A) Immunoblot analysis shows a decreased level of active STAT3Y705 in HN13 and HN30 cells stably expressing GFP-IκB S32/36A with respect to control cells expressing GFP. (B) HaCaT cells were serumstarved and stimulated for 10 minutes with IL-6 (10 ng/ml), or CM from HN13 and HN30 stably expressing GFP-IκB S32/36A and GFP, or CM from HaCaT cells (C) as a control. The addition of IL-6 and CM from HN13 and HN30 cells induces remarkable STAT3 activation (STAT3Y705). The effects of CM on HN13 and HN30 were prevented by the inhibition of NFκB.
Figure 8
Figure 8
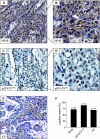
NFκB, pSTAT3, and IL-6 are highly expressed in head and neck (HN) clinical samples. Human oral SCC individual samples and tissue arrays were stained for NFκB p65, pSTAT3Y705, and IL-6. Photographs show representative tumorareas. (A) NFκB is predominantly observed in tumor cells. (B) Cytoplasmatic and nuclear stainings for NFκB are seen at a higher magnification. (C) pSTAT3Y705 is present in the nucleus of tumor cells. (D) Higher magnification. (E) IL-6 is strongly expressed in the cytoplasm of tumor cells. (F) The bar graphs summarize the expression of NFκB, pSTAT3Y705, and IL-6 in the HNSCC tissue array. The number of positive cases is presented as the percentage of tumor tissue samples (n = total number of samples analyzed).
Figure 9
Figure 9
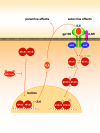
Proposed mechanism of cross-talk between the NFκB and the STAT3 pathways. Constitutive activation of NFκB leads to the production and secretion of cytokines such as IL-6, which acts on the gp130 cytokine receptor family in an autocrine/paracrine manner and causes the consequent activation of STAT3 in an EGFR-independent fashion. Inhibition of NFκB by IκB S32/36A diminishes the secretion of those molecules, thereby blocking the activation of the STA T3 pathway.

Similar articles

Cited by

References

    1. Parkin DM, Bray F, Ferlay J, Pisani P. Global cancer statistics, 2002. CA Cancer J Clin. 2005;55:74–108. - PubMed
    1. Hunter KD, Parkinson EK, Harrison PR. Profiling early head and neck cancer. Nat Rev Cancer. 2005;5:127–135. - PubMed
    1. Forastiere A, Koch W, Trotti A, Sidransky D. Head and neck cancer. N Engl J Med. 2001;345:1890–1900. - PubMed
    1. Dassonville O, Formento JL, Francoual M, Ramaioli A, Santini J, Schneider M, Demard F, Milano G. Expression of epidermal growth factor receptor and survival in upper aerodigestive tract cancer. J Clin Oncol. 1993;11:1873–1878. - PubMed
    1. Grandis JR, Tweardy DJ. Elevated levels of transforming growth factor alpha and epidermal growth factor receptor messenger RNA are early markers of carcinogenesis in head and neck cancer. Cancer Res. 1993;53:3579–3584. - PubMed

MeSH terms