. 2006 Oct;17(10):4526-42.
doi: 10.1091/mbc.e06-07-0579. Epub 2006 Aug 16.

Mammalian CLASP1 and CLASP2 cooperate to ensure mitotic fidelity by regulating spindle and kinetochore function

Affiliations

Mammalian CLASP1 and CLASP2 cooperate to ensure mitotic fidelity by regulating spindle and kinetochore function

Ana L Pereira et al. Mol Biol Cell. 2006 Oct.

Abstract

CLASPs are widely conserved microtubule plus-end-tracking proteins with essential roles in the local regulation of microtubule dynamics. In yeast, Drosophila, and Xenopus, a single CLASP orthologue is present, which is required for mitotic spindle assembly by regulating microtubule dynamics at the kinetochore. In mammals, however, only CLASP1 has been directly implicated in cell division, despite the existence of a second paralogue, CLASP2, whose mitotic roles remain unknown. Here, we show that CLASP2 localization at kinetochores, centrosomes, and spindle throughout mitosis is remarkably similar to CLASP1, both showing fast microtubule-independent turnover rates. Strikingly, primary fibroblasts from Clasp2 knockout mice show numerous spindle and chromosome segregation defects that can be partially rescued by ectopic expression of Clasp1 or Clasp2. Moreover, chromosome segregation rates during anaphase A and B are slower in Clasp2 knockout cells, which is consistent with a role of CLASP2 in the regulation of kinetochore and spindle function. Noteworthy, cell viability/proliferation and spindle checkpoint function were not impaired in Clasp2 knockout cells, but the fidelity of mitosis was strongly compromised, leading to severe chromosomal instability in adult cells. Together, our data support that the partial redundancy of CLASPs during mitosis acts as a possible mechanism to prevent aneuploidy in mammals.


Figures
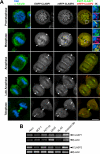
Figure 1.
Figure 1.
Simultaneous expression and colocalization of CLASP1 and CLASP2 throughout mitosis in proliferating cells. (A) HeLa cells stably expressing EGFP-CLASP1 (green, right column) were transiently transfected with mRFP-CLASP2 (red) and stained for α-tubulin (green, left column) and DNA (blue) counterstained with 4,6-diamidino-2-phenylindole (DAPI). Corresponding merged images of cells throughout mitosis show DNA and α-tubulin staining (on the left column) and EGFP-CLASP1 and mRFP-CLASP2 (on the right column). Higher magnifications of indicated chromosomes show kinetochore colocalization of EGFP-CLASP1 and mRFP-CLASP2 and the corresponding merge during prometaphase and metaphase. EGFP-CLASP1 and mRFP-CLASP2 also colocalize at spindle and centrosomes throughout mitosis (arrowheads). From middle anaphase to telophase, EGFP-CLASP1 and mRFP-CLASP2 accumulate at the spindle midzone and midbody. Bar, 10 μm. (B) Expression analysis of endogenous CLASP1 and CLASP2 by RT-PCR in tumor cell lines. β-Actin expression is shown as an internal control for the RT-PCR.
Figure 2.
Figure 2.
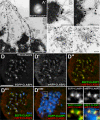
Colocalization of CLASP1 and CLASP2 at the kinetochore. (A–A′) Identification of mitotic EGFP-CLASP1 expressing cells by fluorescence microscopy. The cell shown was processed for immuno-electron microscopy by using anti-GFP primary antibodies with 0.8-nm colloidal gold-conjugated secondary antibodies, revealing the presence of CLASP1 molecules along kinetochore fibers and near the kinetochore-attached MT plus-ends (arrows). Bar, 1 μm. (B–B′) High magnification of two kinetochores from the same cell showing CLASP1 localization at the fibrous corona region, outside the kinetochore outer plate (arrowheads) where MTs were attached. Bar, 0.5 μm. (C–C′) Accumulation of gold-conjugated CLASP1 particles at centrioles and MTs from the pericentriolar material. Bar, 0.5 μm. (D–D″″) Colocalization of CLASP1 and CLASP2 at kinetochores. HeLa cells stably expressing EGFP-CLASP1 (green) were transiently transfected with mRFP-CLASP2 (red) to address their localization at the kinetochores from chromosome spreads prepared in the presence of 10 μM nocodazole to depolymerize MTs. ACA (blue in D″″) was used as an inner kinetochore marker and DNA was counterstained with DAPI (blue in D″″). Interpolated zoom of the selected region in D″″ shows significant colocalization of EGFP-CLASP1 with mRFP-CLASP2 at kinetochores. Bar, 10 μm.
Figure 3.
Figure 3.
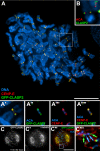
Mapping of the kinetochore localization of human CLASP2 and its dependence on MT dynamics. (A) Colocalization of EGFP-CLASP2 (green) with DNA (or ACA in the higher magnification pictures; blue) and CENP-E (red) in chromosome spreads after treatment with colcemid. In the merged images, colocalization of EGFP-CLASP2 and CENP-E is yellow. (A′–A″″) Interpolated zoom of the selected chromosome from A. (B) Colocalization of endogenous CLASP2 (green) with ACA (red) in chromosome spreads after treatment with colcemid. DNA is in blue. (C–C″) Redistribution of EGFP-CLASP2 after suppression of MT dynamics by incubation with 100 nM taxol. (C‴) Interpolated zoom of the selected region in C″. Note that EGFP-CLASP2 still localizes to kinetochores. Bar, 10 μm.
Figure 4.
Figure 4.
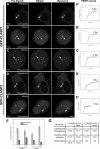
Determination of the turnover rates of CLASPs by FRAP in the absence of MTs. (A and B) Representative frames for bleaching and recovery of centrosomal EGFP-CLASP1 at interphase and mitosis, respectively, in the presence of 10 μM nocodazole. (C) The same experiment was performed for kinetochores. (D and E) Representative frames for bleaching and recovery of centrosomal EGFP-CLASP2 at interphase and mitosis, respectively, in the presence of 10 μM nocodazole. (A′, B′, C′, D′ and E′) The corresponding fluorescence recovery signal after photobleaching was fit to a single-exponential curve as described in Materials and Methods. Inset, half-time of the exponential curve. Bar, 5 μm. (F) Average centrosomal fluorescence recovery half-time is shown as a function of each EGFP-CLASP, the cell cycle stage and the presence of nocodazole (+noc). The error bars represent the SD of the measurements. (G) Summary of the FRAP experiments on centrosomes and kinetochores for EGFP-CLASP1 and EGFP-CLASP2, in the presence and absence of MTs. ND, not determined.
Figure 5.
Figure 5.
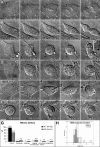
Live-cell imaging of mitotic progression in Clasp2 KO embryonic fibroblasts. (A) Selected frames from a time-lapse sequence of mitosis in a WT MEF. The represented cell is shown from prophase, just before NEB, until anaphase onset and telophase. Chromosomes form a normal metaphase plate and initiated segregation during anaphase in <30 min. (B–D) Selected frames from three time-lapse recordings of Clasp2 KO MEFs from prophase/NEB. (B) Most Clasp2 KO cells entered anaphase with normal kinetics. The cell shown progressed normally through mitosis, entering anaphase in ∼25 min after NEB. (C) A significant percentage of Clasp2 KO cells did, however, show lagging chromosomes (arrowhead and higher magnification inset), despite entering anaphase at the same time as in controls. (D) This cell never formed a metaphase plate, and the chromosomes were organized as rosettes typical of monopolar spindles, without entering anaphase for ∼ 50 min. This delay suggests a functional SAC in Clasp2 KO cells. (E) Clasp2 KO cell entering mitosis in the presence of 10 μM nocodazole. The cell remained in mitosis for more than 2 h, indicating that the SAC is fully functional. (F) Clasp2 KO cell filmed from prometaphase in the presence of 20 μM MG132 was able to form and maintain a metaphase plate. Time is shown in hours:minutes:seconds. Bar, 25 μm. (G) Summary of the quantification of mitotic defects in Clasp2 KO MEFs analyzed by time-lapse DIC microscopy. (H) Quantification of the duration of mitosis from NEB to anaphase onset in WT and Clasp2 KO MEFs. On average, WT MEFs took 26.5 ± 3.7 min (n = 10) and KO MEFs 32.8 ± 11.5 min (n = 24). This difference is not statistically significant (p = 0.1; Student's t test), but in a few cases, Clasp2 KO MEFs took 2 to 3 times longer to enter anaphase than controls.
Figure 6.
Figure 6.
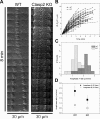
Determination of anaphase rates in WT and Clasp2 KO MEFs. (A) Kymographs of selected WT and KO cells at the metaphase–anaphase transition. (B) Position of chromatid masses over time for the ensembles of trackable cells (17 WT cells and 24 KO cells, respectively). As a reference, the pole-facing chromatid mass edge was used to define its position. The positions at anaphase onset were set to zero by subtraction of the initial distance D0, to facilitate visualization. (C) Anaphase chromosome poleward velocity histograms resulting from linear regression applied to curves in B for the first 2 min (anaphase A). (D) Average and SD for chromosome velocity during anaphase A and B.
Figure 7.
Figure 7.
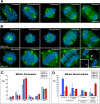
Mitosis in mouse embryonic and adult fibroblasts derived from Clasp2 KO mice. (A and B) Immunofluorescence analyses of wild-type and Clasp2 KO embryonic and adult fibroblasts, respectively. MEFs and MAFs were immunostained to reveal the mitotic spindle and centrosomes by antibody detection of α-tubulin (green) and γ-tubulin (red), respectively, and DNA was counterstained with DAPI (blue). (A) Normal mitosis from wild-type MEFs, from prophase to telophase. (B) Fibroblasts lacking Clasp2 show a higher incidence of spindle abnormalities such as monopolar, disorganized, and multipolar spindles as well as several aneuploidy and chromosome missegregation events. (C) Quantification of the frequency of mitotic events in WT and KO fibroblasts. (D) Quantification of the frequency of mitotic abnormalities in WT and KO fibroblasts. Both charts show average numbers from three independent experiments, and error bars correspond to SD. In total, 5000–10,000 cells were scored for each genotype. Bar, 10 μm.
Figure 8.
Figure 8.
Rescue of mitotic defects in Clasp2 KO MEFs by ectopic expression of EGFP-CLASP1 or EGFP-CLASP2. (A and B) Clasp2 KO MEFs were transduced with recombinant lentivirus containing EGFP-CLASP1 or EGFP-CLASP2 vectors and analyzed with the fluorescence microscope. Bar, 25 μm. (C–D″) Prometaphase and metaphase Clasp2 KO MEFs expressing ectopic EGFP-CLASP1 (green), which was able to target to kinetochores. (E–F″) Prometaphase and metaphase Clasp2 KO MEFs expressing ectopic EGFP-CLASP2 (green), which showed normal localization at kinetochores. Selected chromosomes are shown at higher magnification on the right columns. DNA was counterstained with DAPI (blue). Bar, 10 μm. (G) Quantification of mitotic defects in Clasp2 KO MEFs before and after rescue with ectopic EGFP-CLASP1 or EGFP-CLASP2. Values represent the average numbers from three independent experiments, and error bars correspond to SD.
Figure 9.
Figure 9.
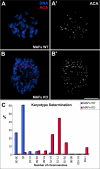
Karyotype determination in Clasp2 KO adult fibroblasts. (A–A′) Chromosome spread from a WT adult fibroblast showing DNA (blue) and ACA staining at kinetochores (red). The normal euploid number of chromosomes in mice is 40. (B–B′) Chromosome spread from a Clasp2 KO adult fibroblast showing DNA (blue) and ACA staining at kinetochores (red). A higher chromosome number is evident. (C) Quantification of the typical chromosome number in WT and Clasp2 KO MAFs. Clasp2 KO MAFs show severe chromosomal instability with a peak distribution between 71 and 75 chromosomes per cell. Bar, 10 μm.

Similar articles

Cited by

References

    1. Akhmanova A., Hoogenraad C. C. Microtubule plus-end-tracking proteins: mechanisms and functions. Curr. Opin. Cell Biol. 2005;17:47–54. - PubMed
    1. Akhmanova A., et al. Clasps are CLIP-115 and -170 associating proteins involved in the regional regulation of microtubule dynamics in motile fibroblasts. Cell. 2001;104:923–935. - PubMed
    1. Akhmanova A., et al. The microtubule plus-end-tracking protein CLIP-170 associates with the spermatid manchette and is essential for spermatogenesis. Genes Dev. 2005;19:2501–2515. - PMC - PubMed
    1. Amin-Hanjani S., Wadsworth P. Inhibition of spindle elongation by taxol. Cell Motil. Cytoskeleton. 1991;20:136–144. - PubMed
    1. Ault J. G., DeMarco A. J., Salmon E. D., Rieder C. L. Studies on the ejection properties of asters: astral microtubule turnover influences the oscillatory behavior and positioning of mono-oriented chromosomes. J. Cell Sci. 1991;99:701–710. - PubMed

Publication types

Substances