Comparative Study
. 2006 Aug 8;16(15):1489-501.
doi: 10.1016/j.cub.2006.06.063.

Mps1 phosphorylation of Dam1 couples kinetochores to microtubule plus ends at metaphase

Affiliations
Comparative Study

Mps1 phosphorylation of Dam1 couples kinetochores to microtubule plus ends at metaphase

Michelle M Shimogawa et al. Curr Biol. .

Abstract

Background: Duplicated chromosomes are equally segregated to daughter cells by a bipolar mitotic spindle during cell division. By metaphase, sister chromatids are coupled to microtubule (MT) plus ends from opposite poles of the bipolar spindle via kinetochores. Here we describe a phosphorylation event that promotes the coupling of kinetochores to microtubule plus ends.

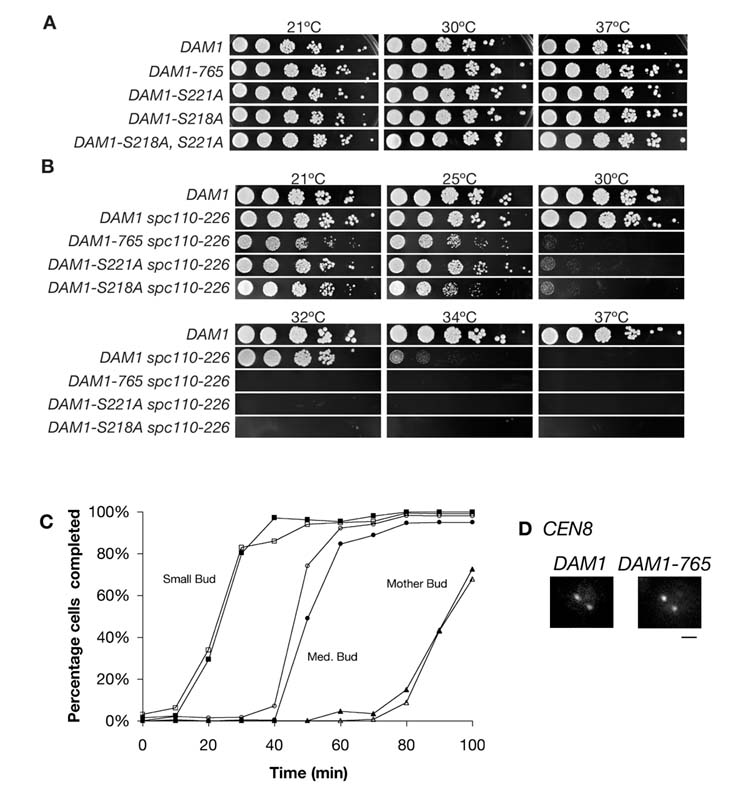
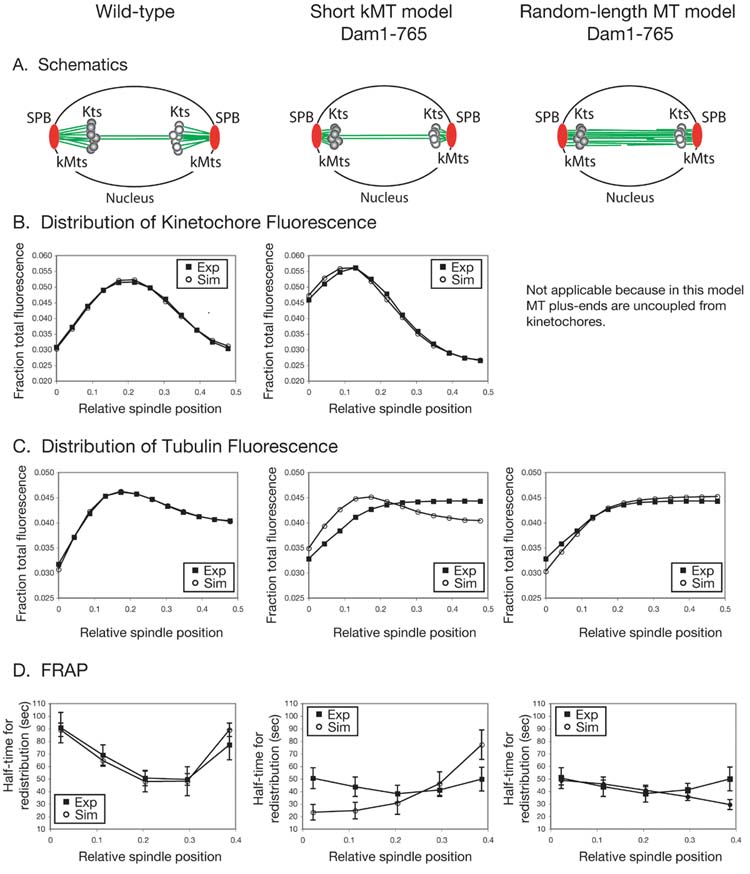
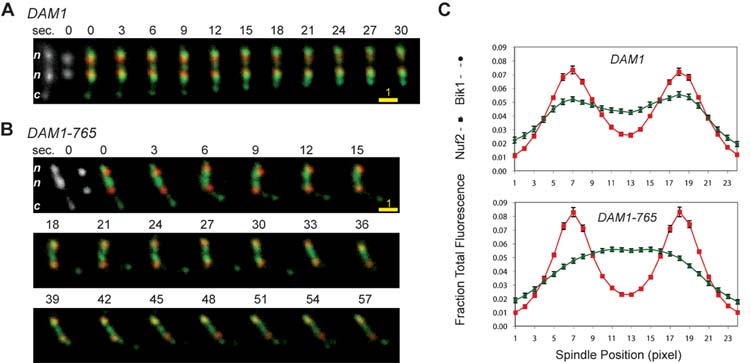
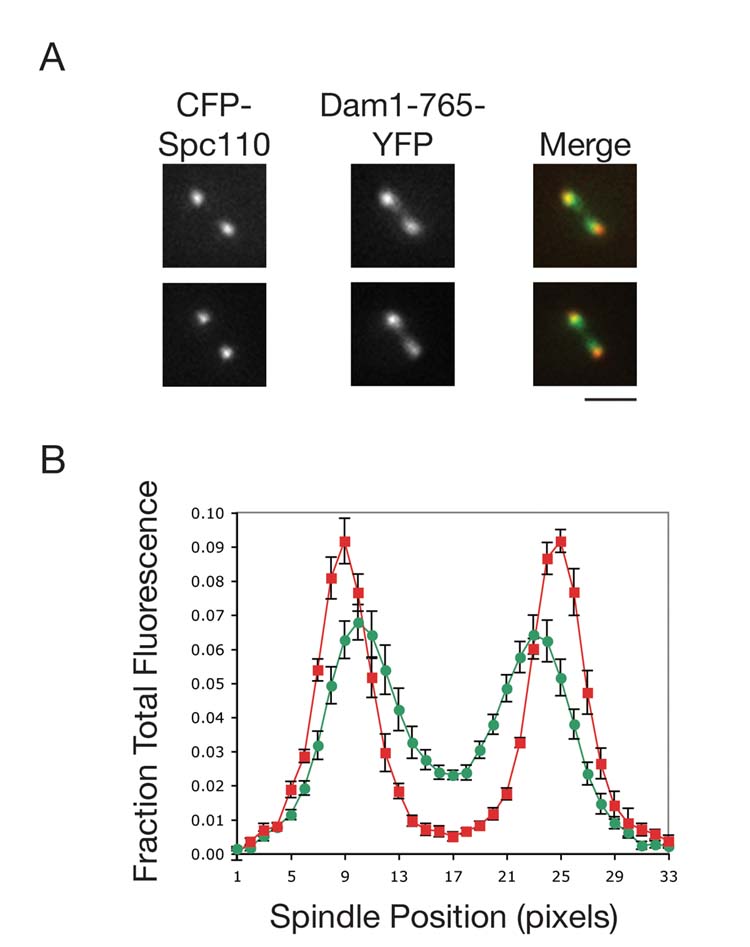
Results: Dam1 is a kinetochore component that directly binds to microtubules. We identified DAM1-765, a dominant allele of DAM1, in a genetic screen for mutations that increase stress on the spindle pole body (SPB) in Saccharomyces cerevisiae. DAM1-765 contains the single mutation S221F. We show that S221 is one of six Dam1 serines (S13, S49, S217, S218, S221, and S232) phosphorylated by Mps1 in vitro. In cells with single mutations S221F, S218A, or S221A, kinetochores in the metaphase spindle form tight clusters that are closer to the SPBs than in a wild-type cell. Five lines of experimental evidence, including localization of spindle components by fluorescence microscopy, measurement of microtubule dynamics by fluorescence redistribution after photobleaching, and reconstructions of three-dimensional structure by electron tomography, combined with computational modeling of microtubule behavior strongly indicate that, unlike wild-type kinetochores, Dam1-765 kinetochores do not colocalize with an equal number of plus ends. Despite the uncoupling of the kinetochores from the plus ends of MTs, the DAM1-765 cells are viable, complete the cell cycle with the same kinetics as wild-type cells, and biorient their chromosomes as efficiently as wild-type cells.

Conclusions: We conclude that phosphorylation of Dam1 residues S218 and S221 by Mps1 is required for efficient coupling of kinetochores to MT plus ends. We find that efficient plus-end coupling is not required for (1) maintenance of chromosome biorientation, (2) maintenance of tension between sister kinetochores, or (3) chromosome segregation.


Figures

Figure 1
Figure 1
Growth of DAM1 Mutants in the Presence and Absence of the spc110-226 Allele (A and B) Growth of DAM1 mutants in the presence of SPC110 (A) or spc110-226 (B). Cultures were grown in YPD at 21°C, sonicated, and diluted to 1 × 10⁶ cfu/ml. Aliquots (3 μl) of the culture and 5-fold serial dilutions were plated on YPD and incubated at the indicated temperature for 2 days. The strains are given in lines 5, 6, 13, 14, 17, 18, and 21–23 of Table S5. (C) DAM1-765 does not delay progression through the cell cycle. DAM1-765, SPC110 (open symbols, BGY12-3A) and DAM1, SPC110 (closed symbols, BGY13-6D) were synchronized in G1 by treatment with α-factor as described [19] and released into YPD at 30°C. Samples were removed at the times shown, fixed in 3.7% formaldehyde, and analyzed by phase-contrast microscopy. Small bud, cells that have budded; Med. Bud, cells that have a medium-sized bud or larger; Mother bud, cells in which the mother cell or both mother and daughter cell have budded. (D) Biorientation occurs efficiently in DAM1-765 cells. DAM1-765, SPC110 (MSY103-19D), and DAM1, SPC110 (MSY105-29A) strains containing cdc26Δ and a tagged CEN8 were arrested in metaphase by a shift to 37°C for 4 hr, fixed in 3.7% formaldehyde, and imaged. Representative images are shown. Seventy-two percent of DAM1 and DAM1-765 cells contained separated sister centromeres. The scale bar represents 1 μm.
Figure 2
Figure 2
Kinetochore Distribution in DAM1 Mutants (A) The distribution of kinetochore fluorescence was measured in metaphase spindles of strains labeled with Spc97-CFP and Nuf2-Venus as described in the Experimental Procedures. In each panel a sample image of the strain is shown with Spc97-CFP (red) and Nuf2-Venus (green). Spindle position 0.0 is the SPB, and position 0.5 is the spindle equator. The gray curve with open squares in each panel is the wild-type kinetochore distribution for comparison. Strains are listed in lines 33–38 of Table S5. (B) Dam1-765-CFP (red) colocalizes with Nuf2-Venus (green). Strains MSY79-1C and MSY81-6D were imaged live. The scale bar represents 1 μm. (C) Quantification of the distribution of Dam1-765-CFP (red circles) and Nuf2-Venus (green squares) in metaphase spindles. The average meta-phase Nuf2 kinetochore separation in DAM1 and DAM1-765 cells was measured in strains tagged with Spc97-CFP and Nuf2-Venus to be 12 and 14 pixels, respectively (Table 1). The distributions of Dam1 or Dam1-765 and Nuf2 were quantified for spindles, imaged as in (B), that displayed the specified average Nuf2 separations. The distributions of Dam1 or Dam1-765 and Nuf2 were measured along the axis joining the two peaks of Nuf2 to endpoints that extend past the ends of the spindle to a final length of 28 pixels. Background was subtracted. The error bars represent the standard error of the mean.
Figure 3
Figure 3
Computer Simulations of DAM1-765 Spindle Phenotype (A) Schematics depicting the organization of wild-type spindles, the short-kMT model for DAM1-765, and the random-length MT model for DAM1-765. Each green line represents two microtubules. Each circle represents two kinetochores. The wild-type and short-kMT models contain 32 kinetochore microtubules connecting kinetochores to SPBs (16 from each pole) and eight interpolar microtubules (four from each pole) and are derived from [6, 47]. The random-length MT model contains 32 microtubules and assumes that kinetochores are uncoupled from plus ends. In panels (B)–(D), the graphs are ordered from left to right as labeled at the top: wild-type, short-kMT model, and random-length MT model. (B) The distribution of kinetochore fluorescence can be computationally simulated. The curves show quantification of the kinetochore fluorescence distribution from experimental (closed squares) and simulated (open circles) images. The distribution of kinetochore fluorescence was measured for strains MSY107-5D (wild-type) and MSY108-8B (DAM1-765) containing Nuf2-GFP and Spc110-Cherry. Metaphase spindles were chosen as described [7]. kMT dynamics were simulated as described in the Experimental Procedures for wild-type control spindles with only minor adjustments to the parameters used in previous work [7]. The gradient in the catastrophe frequency and the tension-dependent rescue gradient were the same as in [7]. Vg = Vs = 1.5 μm/min. The distribution of kinetochore fluorescence in DAM1-765 can be simulated by parameters that yield short kMTs (Table S4). The standard error of the mean is the size of the symbols (or less). (C and D) Tubulin fluorescence and FRAP by spindle position in wild-type control spindles were simulated with the same parameters that simulated kinetochore fluorescence in (B). In contrast, the parameters that successfully simulated DAM1-765 kinetochore fluorescence in the short-kMT model in (B) were unable to simulate the experimental tubulin fluorescence or the FRAP by spindle position. Instead, tubulin fluorescence and FRAP data for DAM1-765 were simulated by a set of parameters that produce a random distribution of microtubule lengths (graphs in the right-hand column). The curves show quantification of the tubulin fluorescence distribution or FRAP half-times from experimental images (closed squares) and simulated images (open circles). The distribution of tubulin fluorescence was measured for strains MSY97-64B (wild-type) and MSY98-3A (DAM1-765) containing GFP-Tub1 and Spc110-Cherry. FRAP was performed on strains BGY1-12B (wild-type) and BGY2-1D (DAM1-765) as described [23, 48]. The time to half-maximal redistribution was calculated for the bleached half spindle at intervals along the length of the spindle as described [23]. The standard error of the mean in (C) is the size of the symbols (or less). The error bars shown in (D) represent the standard deviation.
Figure 4
Figure 4
Bik1 Does Not Colocalize with Kinetochores in DAM1-765 Mutant Spindles Distribution of Bik1-3xGFP relative to kinetochores (Nuf2-Cherry) in mutant and wild-type cells. (A) Time-lapse images of a DAM1 cell (strain MSY59). The first two panels, respectively, show Bik1-3xGFP and Nuf2-Cherry alone. Exposures of 0.4 s were taken every 3 s. Red: Nuf2-Cherry. Green: Bik1-3xGFP. n: nuclear Bik1. c: cytoplasmic Bik1. The scale bar represents 1 μm. (B) Time-lapse images of a DAM1-765 cell (strain MSY58) as in (A). The first two panels, respectively, show Bik1-3xGFP and Nuf2-Cherry alone. Red: Nuf2-Cherry. Green: Bik1-3xGFP. n: nuclear Bik1. c: cytoplasmic Bik1. The scale bar represents 1 μm. (C) Distributions of Bik1-3xGFP (green circles) and Nuf2-Cherry (red squares) were measured in spindles with separated kinetochores. The distributions of Nuf2 and Bik1 were measured along the axis joining the two peaks of Nuf2 to endpoints separated by twice the Nuf2 separation. Background was subtracted. For comparison, all distributions were normalized to a length of 24 pixels. The error bars represent the standard error of the mean.
Figure 5
Figure 5
Tomographic Reconstructions of DAM1-765 Spindles Electron tomography of strain SFY144 (DAM1-765) was performed. Models of tomographic reconstructions of three spindles are shown (A, B, and C). Microtubules are shown as cylinders. Flared plus ends are marked by spheres. SPBs are shown as flat blue disks. The scale bar represents 100 nm. Movies of these models are given in the Supplemental Data. (D) The lengths of microtubules between 100 and 1000 nm are randomly distributed, as shown in a cumulative distribution plot of microtubule lengths in the three spindles. The distribution of microtubule lengths between 100 and 1000 nm shows a good fit to the predicted plot for a random distribution of microtubule lengths (solid line). (E and F) The distribution of tubulin fluorescence (E) or FRAP by spindle position (F) was predicted for spindles with the same distribution of microtubule lengths as found in the tomographic reconstructions. Open circles represent simulated data, and closed squares represent experimental data. The error bars represent the standard deviation.
Figure 6
Figure 6
Kinetochore Position Relative to Microtubule Minus Ends (A) Two examples of images of live MSY147-9C cells in which Spc110 is tagged with CFP on the N terminus and Dam1-765 is tagged with YFP on the C terminus. The scale bar represents 1 μm. (B) Quantification of the distribution of YFP-Spc110 (green circles) and Dam1-765-CFP (red squares) in metaphase spindles. The average distributions for metaphase spindles of a single length are shown. The distributions of Spc110 and Dam1-765 were measured along the axis joining the two peaks of Spc110 to endpoints that extend 50% of the spindle length past each SPB. The error bars represent the standard error of the mean.
Figure 7
Figure 7
Model for Role of Mps1 Phosphorylation of Dam1 on Residues S218 or S221 In wild-type cells, kinetochores can be captured laterally by a microtubule and transported along the microtubule toward the pole. This Dam1-independent lateral attachment is converted to a Dam1-dependent attachment. When Dam1 is phosphorylated by Mps1 on residues S218 and S221, the kinetochore becomes coupled to the plus end of the microtubule. Coupling of the kinetochore to the plus end restricts the microtubule dynamics of the plus end such that kinetochores stay in their half spindle. In the DAM1-765 mutant, the kinetochore does not efficiently associate with the plus end. The sister kinetochores are still bioriented and maintained under tension. The microtubule dynamics are deregulated such that the microtubules are not uniform in length.

Similar articles

Cited by

References

    1. Rieder CL, Alexander SP. Kinetochores are transported poleward along a single astral microtubule during chromosome attachment to the spindle in newt lung cells. J Cell Biol. 1990;110:81–95. - PMC - PubMed
    1. Hayden JH, Bowser SS, Rieder CL. Kinetochores capture astral microtubules during chromosome attachment to the mitotic spindle: Direct visualization in live newt lung cells. J Cell Biol. 1990;111:1039–1045. - PMC - PubMed
    1. Merdes A, De Mey J. The mechanism of kinetochore-spindle attachment and polewards movement analyzed in PtK2 cells at the prophase-prometaphase transition. Eur J Cell Biol. 1990;53:313–325. - PubMed
    1. Rieder CL, Salmon ED. The vertebrate cell kinetochore and its roles during mitosis. Trends Cell Biol. 1998;8:310–318. - PMC - PubMed
    1. Tanaka K, Mukae N, Dewar H, van Breugel M, James EK, Prescott AR, Antony C, Tanaka TU. Molecular mechanisms of kinetochore capture by spindle microtubules. Nature. 2005;434:987–994. - PubMed

Publication types

MeSH terms

Substances