. 2006 Oct 15;576(Pt 2):457-76.
doi: 10.1113/jphysiol.2006.114918. Epub 2006 Aug 3.

Spontaneous rhythmic field potentials of isolated mouse hippocampal-subicular-entorhinal cortices in vitro

Affiliations

Spontaneous rhythmic field potentials of isolated mouse hippocampal-subicular-entorhinal cortices in vitro

C P Wu et al. J Physiol. .

Abstract

The rodent hippocampal circuit is capable of exhibiting in vitro spontaneous rhythmic field potentials (SRFPs) of 1-4 Hz that originate from the CA3 area and spread to the CA1 area. These SRFPs are largely correlated with GABA-A IPSPs in pyramidal neurons and repetitive discharges in inhibitory interneurons. As such, their generation is thought to result from cooperative network activities involving both pyramidal neurons and GABAergic interneurons. Considering that the hippocampus, subiculum and entorhinal cortex function as an integrated system crucial for memory and cognition, it is of interest to know whether similar SRFPs occur in hippocampal output structures (that is, the subiculum and entorhinal cortex), and if so, to understand the cellular basis of these subicular and entorhinal SRFPs as well as their temporal relation to hippocampal SRFPs. We explored these issues in the present study using thick hippocampal-subicular-entorhinal cortical slices prepared from adult mice. SRFPs were found to spread from the CA1 area to the subicular and entorhinal cortical areas. Subicular and entorhinal cortical SRFPs were correlated with mixed IPSPs/EPSPs in local pyramidal neurons, and their generation was dependent upon the activities of GABA-A and AMPA glutamate receptors. In addition, the isolated subicular circuit could elicit SRFPs independent of CA3 inputs. We hypothesize that the SRFPs represent a basal oscillatory activity of the hippocampal-subicular-entorhinal cortices and that the subiculum functions as both a relay and an amplifier, spreading the SRFPs from the hippocampus to the entorhinal cortex.


Figures
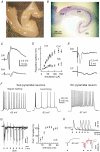
Figure 1
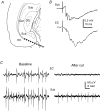
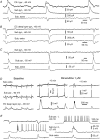
Figure 1. Basic electrophysiological properties of thick hippocampal–subicular–EC slices
A, a photo taken from a freshly prepared thick slice. Yellow dashed lines indicate the positions at which surgical cuts can be made to produce miniature CA1–subicular slices. Arrowheads show the position of a bipolar stimulating electrode used to stimulate the perforant pathway, Schaffer collateral pathway or subicular–EC projection pathway. The filled circle or square denotes the position of the stimulating electrode for evoking subicular population spikes or evoking EC field potentials, respectively. Sub, subiculum; EC, entorhinal cortex; DG, dentate gyrus. B, a representative section (15 μm thickness) was obtained from a fixed thick slice and stained with cresyl violet. C, CA1 and subicular synaptic field potentials were evoked by stimulating the dentate gyrus area. Illustrated traces were averaged from five consecutive measurements. D, the amplitudes (mean ± s.e.m.) of CA1 and subicular population spikes were plotted against the strengths of dentate gyrus stimulation (constant current pulses of 0.1 ms and 20–150 μA). E, subicular and EC (deep layer) field potentials evoked by stimulating the subicular area; illustrated traces were averaged from five consecutive responses. F, intracellular traces were collected from two subicular pyramidal neurons and an EC deep layer pyramidal neuron at indicated resting potentials. Repetitive discharges were evoked by intracellular injections of depolarizing current pulses of 300–500 pA. G, subicular population spikes were evoked by paired stimuli (arrowheads) in a thick slice. The amplitude ratios (mean ± s.e.m.) of the second/first population spikes were calculated from five slices and plotted against interstimulus intervals. H, intracellular traces were collected from a subicular pyramidal neuron at indicated membrane potentials. Top trace, voltage responses were evoked by paired stimuli at different interstimulation intervals. Bottom trace, currents were evoked by a subthreshold stimulus (left) and super-threshold stimuli at two intervals (right). The spike currents (right) were truncated for illustration purposes. Note the lack of spike current following the second stimulus when applied ∼7 ms after the first stimulus (red trace).
Figure 9
Figure 9. Subicular SRFPs observed from conventional coronal slices
A, a schematic illustration of CA1, subicular and EC areas in coronal brain slices. The thick dashed line denotes the position of a surgical cut used to separate the EC and subicular areas. B, subicular (top) and EC deep layer (bottom) field potentials were evoked by stimulation of the distal CA1 area. Illustrated traces were averaged from six consecutive responses. C, representative SRFPs were recorded simultaneously from the subicular and EC deep layer areas before (left) and after (right) a surgical cut that separated the two recording sites.
Figure 2
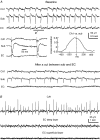
Figure 2. Regional SRFPs
A, extracellular traces were collected simultaneously from the CA1, subicular and EC deep layer areas of a thick slice. Top, baseline SRFPs. Middle, two representative SRFP events are shown in a fast sweep. A cross correlation plot was generated from five consecutive SRFP events including the two shown. Bottom, traces were collected ∼30 min after a surgical cut that separated the subicular and EC recording sites. B, extracellular traces were collected from an ‘intact’ thick slice, showing coherent SRFPs in CA1 and EC deep layer areas but not in the EC superficial layer area.
Figure 3
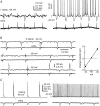
Figure 3. Intracellular correlates of subicular SRFPs
Data were obtained via simultaneous whole-cell recordings together with extracellular monitoring of local field potentials. A, voltage traces were collected from a subicular regular spiking pyramidal neuron at resting (∼−67 mV, right) and depolarized (∼−45 mV, left) potentials. Spike amplitudes in the right-hand traces were truncated for illustration purposes. B, current traces were collected from other regular spiking subicular pyramidal neuron at indicated different holding potentials. The charge transfer of SRFP-correlated synaptic currents (mean ± s.e.m. calculated from 30 consecutive events) was plotted against holding potentials. The line through data points was computed by a linear regression function (r = 0.98). C, voltage traces were collected from a burst firing subicular pyramidal neuron at resting (∼−58 mV, left) and depolarizing (∼−40 mV, right) potentials.
Figure 4
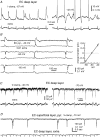
Figure 4. Intracellular correlates of EC SRFPs
Data were collected via simultaneous whole-cell recordings together with extracellular monitoring of field potentials. A, voltage traces were collected from an EC deep layer pyramidal neuron at resting (∼−67 mV, left) and positive (∼−42 mV, right) potentials. B, current traces were collected from another deep layer pyramidal neuron at indicated holding potentials. The charge transfer of SRFP-correlated synaptic currents (mean ± s.e.m. calculated from 30 consecutive events) was plotted against holding potentials. The line through data points was computed by a linear regression function (r = 0.94). C, current traces were collected from another EC deep layer pyramidal neuron at indicated holding potentials. D, current traces were collected from a superficial layer pyramidal neuron at −70 mV.
Figure 5
Figure 5. SRFP-correlated intracellular activities
Data were obtained via dual whole-cell recordings together with extracellular monitoring of subicular field potentials. AC, representative current traces were collected at indicated holding potentials, and paired recordings were made from a subicular and a CA1 pyramidal neuron (A), from an EC deep layer and a subicular pyramidal neuron (B), and from two subicular pyramidal neurons (C). D, voltage traces were collected from a subicular pyramidal neuron and an EC deep layer pyramidal neuron during baseline recordings and following perfusion of ∼1 μm bicuculline; initial resting potentials are indicated. E, voltage traces were collected from two subicular pyramidal neurons at indicated initial resting potentials. For each neuron, traces were presented at a low and high gain to show action potentials and synaptic potentials, respectively. Repetitive discharges were induced by intracellular injection of depolarizing currents (300 pA).
Figure 6
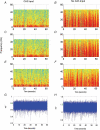
Figure 6. Spectrograms of subicular rhythms at 0.5 s resolution
Each spectrogram is from an individual slice. Amplitude is normalized with red representing high power to blue representing low power. A, C and E, rhythms taken from slices with CA3 input. B, D and F, rhythms taken from slices without CA3 input. G and H, unfiltered extracellular recording data of subicular rhythms used in A and B, respectively.
Figure 7
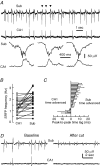
Figure 7. SRFPs observed from CA1–subicular miniature slices
A, representative extracellular traces were recorded simultaneously from the subicular and CA1 areas of a miniature slice. Arrows denoting SRFP events are shown in fast sweeps. B, frequencies of CA1 and subicular SRFPs were measured from 23 miniature slices. Data points represent mean frequencies calculated from ≥ 60 consecutive SRFP events in individual slices, and the frequencies of corresponding regional SRFPs are linked with continuous lines. C, peak-to-peak time lags of CA1 and subicular SRFPs were measured from ≥ 60 consecutive SRFP events; the mean time lags of individual slices are presented. D, representative traces were recorded from the subicular and CA1 areas of a miniature slice. A surgical cut was made after baseline recordings to separate the two recording sites. Note the absence of spontaneous field potentials in the isolated CA1 area after the cut.
Figure 8
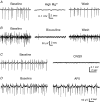
Figure 8. Pharmacological responses of subicular SRFPs
Extracellular traces were collected from the subicular area of four different miniature slices. A, subicular SRFPs were reversibly blocked by a high-Mg2+ ACSF (6 mm). BD, bicuculline (10 μm), CNQX (10 μm) or AP5 (100 μm), respectively, was applied for 6–8 min, and traces were collected before and at the end of drug application.

Similar articles

Cited by

References

    1. Akay M. New York: IEEE Press; 1997. Time-frequency and wavelets in biomedical signal processing.
    1. Amaral DG, Witter MP. The three-dimensional organization of the hippocampal formation: a review of anatomical data. Neuroscience. 1989;31:571–591. - PubMed
    1. Anderson MI, O'Mara SM. Analysis of recordings of single-unit firing and population activity in the dorsal subiculum of unrestrained, freely moving rats. J Neurophysiol. 2003;90:655–665. - PubMed
    1. Anderton BH, Callahan L, Coleman P, Davies P, Flood D, Jicha GA, Ohm T, Weaver C. Dendritic changes in Alzheimer's disease and factors that may underlie these changes. Prog Neurobiol. 1998;55:595–609. - PubMed
    1. Battaglia FP, Sutherland GR, McNaughton BL. Hippocampal sharp wave bursts coincide with neocortical ‘up-state’ transitions. Learn Mem. 2004;11:697–704. - PMC - PubMed

Publication types

Substances