. 2006 Aug;26(16):6065-81.
doi: 10.1128/MCB.00203-06.

Phosphatidylinositol 3-phosphate [PtdIns3P] is generated at the plasma membrane by an inositol polyphosphate 5-phosphatase: endogenous PtdIns3P can promote GLUT4 translocation to the plasma membrane

Affiliations

Phosphatidylinositol 3-phosphate [PtdIns3P] is generated at the plasma membrane by an inositol polyphosphate 5-phosphatase: endogenous PtdIns3P can promote GLUT4 translocation to the plasma membrane

Anne M Kong et al. Mol Cell Biol. 2006 Aug.

Abstract

Exogenous delivery of carrier-linked phosphatidylinositol 3-phosphate [PtdIns(3)P] to adipocytes promotes the trafficking, but not the insertion, of the glucose transporter GLUT4 into the plasma membrane. However, it is yet to be demonstrated if endogenous PtdIns(3)P regulates GLUT4 trafficking and, in addition, the metabolic pathways mediating plasma membrane PtdIns(3)P synthesis are uncharacterized. In unstimulated 3T3-L1 adipocytes, conditions under which PtdIns(3,4,5)P3 was not synthesized, ectopic expression of wild-type, but not catalytically inactive 72-kDa inositol polyphosphate 5-phosphatase (72-5ptase), generated PtdIns(3)P at the plasma membrane. Immunoprecipitated 72-5ptase from adipocytes hydrolyzed PtdIns(3,5)P2, forming PtdIns(3)P. Overexpression of the 72-5ptase was used to functionally dissect the role of endogenous PtdIns(3)P in GLUT4 translocation and/or plasma membrane insertion. In unstimulated adipocytes wild type, but not catalytically inactive, 72-5ptase, promoted GLUT4 translocation and insertion into the plasma membrane but not glucose uptake. Overexpression of FLAG-2xFYVE/Hrs, which binds and sequesters PtdIns(3)P, blocked 72-5ptase-induced GLUT4 translocation. Actin monomer binding, using latrunculin A treatment, also blocked 72-5ptase-stimulated GLUT4 translocation. 72-5ptase expression promoted GLUT4 trafficking via a Rab11-dependent pathway but not by Rab5-mediated endocytosis. Therefore, endogenous PtdIns(3)P at the plasma membrane promotes GLUT4 translocation.


Figures
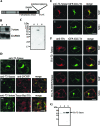
FIG. 1.
FIG. 1.
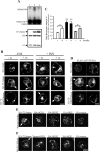
Expression and intracellular localization of 72-5ptase in 3T3-L1 adipocytes. (A) 72-5ptase domain structure showing proline-rich (PxxP) motifs (white boxes), the catalytic domain (black box), the D480N mutation which renders the enzyme inactive, and the C-terminal peptide sequence used to raise polyclonal antibodies. (B) Northern blot containing mRNA (20 μg) from precursor 3T3-L1 fibroblasts (p) or differentiated 3T3-L1 adipocytes (a) was hybridized with 72-5ptase cDNA (nucleotides 595 to 2538) (upper panel). After exposure, the membrane was hybridized to a GAPDH probe (lower panel). (C) Detergent-soluble (s), detergent-insoluble (i), and cytosolic (c) lysates of differentiated 3T3-L1 adipocytes (50 μg) were immunoblotted with 72-5ptase antibodies. (D and E) Differentiated 3T3-L1 adipocytes were labeled with 72-5ptase-specific antibodies (i) and markers for Golgi (β-COP antibody) (ii), sorting and recycling endosomes (Texas Red-transferrin) (D), or GLUT4 (GFP-GLUT4) in resting (−INS) or insulin-stimulated (+INS) cells (E). (F) Resting (−INS) or insulin-stimulated (+INS) 3T3-L1 adipocytes coexpressing recombinant HA-72-5ptase or inactive HA-72-D480N5ptase and GFP-GLUT4 were labeled with HA-specific antibodies. Scale bar, 10 μm. (G) Cell lysates from vector (lane 1)-, HA-72-5ptase (lane 2)-, or HA-72-D480N5ptase (lane 3)-transfected adipocytes were immunoblotted with HA-specific antibodies.
FIG. 2.
FIG. 2.
The 72-5ptase regulates PtdIns(3,4,5)P3 levels in insulin-treated 3T3-L1 adipocytes. (A) HA immunoprecipitates from COS-7 cells transfected with HA-vector (lanes 1 and 2), HA-72-5ptase (lanes 3 and 4), or HA-72-D480N5ptase (lanes 5 and 6) were subjected to PtdIns(32P-3,4,5)P3 5-phosphatase assays. Lipids were extracted and analyzed by thin-layer chromatography. An autoradiogram, representative of three independent PtdIns(3,4,5)P3 5-phosphatase assays, is shown (upper panel). The migration of standards for PtdIns(3,4)P2, or PtdIns(3,4,5)P3 is indicated. Parallel HA immunoprecipitates immunoblotted with HA antibody (lower panel), HA-vector (lane 1), HA-72-5ptase (lane 2), and HA-72-D480N5ptase (lane 3). (B) 3T3-L1 adipocytes expressing GFP-PH/ARNO and the indicated constructs were stimulated with 100 nM insulin for 2 or 5 min. Representative cells are shown. Scale bar, 10 μm. (C) The ratio of fluorescence intensity of GFP-PH/ARNO at the PM (average fluorescence intensity of three defined boxes of 5 × 10 pixels of the plasma membrane per cell) to that of the cytosol (average fluorescence intensity of three boxes of defined area of 10 × 10 pixels per cell) was determined using Image J software. Bars (empty vector, white bars; wild-type 72-5ptase, black bars; inactive 72-5ptase, gray bars) represent the mean ± the standard error of the mean (SEM) of two independent experiments with >20 cells scored for each construct for each time point (*, P < 0.05; **, P < 0.01 compared to same conditions for cells expressing HA-vector or HA-72-D480N5ptase). (D) Adipocytes transduced with the indicated constructs were serum starved and treated with 10 nM insulin for 3, 10, or 30 min. Lysates were immunoblotted with Akt or phospho(Ser473)-Akt antibody. Representative blots of four independent experiments are shown.
FIG. 3.
FIG. 3.
The 72-5ptase hydrolyzes PtdIns(3,5)P2, forming PtdIns(3)P. (A) PtdIns(32P-3,5)P2 5-phosphatase assays of HA immunoprecipitates from adipocytes transfected with HA-vector (lane 1), HA-72-5ptase (lane 2), or HA-72-D480N5ptase (lane 3). Extracted lipids were separated by thin-layer chromatography and visualized by autoradiography. An autoradiogram representative of three independent PtdIns(3,5)P2 5-phosphatase assays is shown (upper panel). The migration of labeled standards for PtdIns(32P-3)P or PtdIns(32P-3,5)P2 is indicated. The lower panel shows parallel HA immunoprecipitates immunoblotted with HA antibody. The migration of immunoglobulin G light (LC) and heavy chains (HC) are shown. (B) Localization of GFP-FYVE/EEA1 in cells cotransfected with GFP-FYVE/EEA1 and HA-vector, HA-72-5ptase, or HA-72-D480N5ptase, treated or not treated with 300 nM insulin (10 min) in the absence (−) or presence (+) of 100 nM wortmannin (w). Single confocal laser-scanning sections through the middle of representative cells shows PtdIns(3)P at the PM (arrows). Representative images from four independent transfections are shown. (C) The fluorescence intensity of GFP-FYVE/EEA1 at the PM relative to that in the cytosol (excluding vesicular fluorescence) was determined, in untreated cells or cells treated with 300 nM insulin for 10 min, using Image J software. The average fluorescence intensity of three defined boxes of 5 × 10 pixels of the plasma membrane per cell was determined relative to that of the cytosol (average fluorescence intensity of three boxes of defined area of 10 × 10 pixels per cell). Bars (empty vector, white bars; wild-type 72-5ptase, black bars; inactive 72-ptase, gray bars) represent mean ± the SEM of three independent experiments (>20 cells were scored for each construct for unstimulated and insulin-stimulated conditions) (*, P < 0.05; **, P < 0.01 compared to same conditions for cells expressing HA-vector or HA-72-D480N5ptase). (D) Localization of FLAG-2xFYVE/Hrs in serum-starved cells cotransfected with HA-vector, HA-72-5ptase, or HA-72-D480N5ptase as indicated. Representative images from three independent transfections are shown. (E and F) Localization of GFP-2xFYVE/Hrs (E) or GFP-FYVE/EEA1 (F) in serum-starved 3T3-L1 adipocytes coexpressing HA-72-5ptase, HA-(or Xpress-)OCRL, HA-SKIP, HA-SHIP2, or HA-vector. Arrows indicate the PM localization of PtdIns(3)P-binding proteins in HA-72-5ptase-expressing cells. Scale bar, 10 μm.
FIG. 4.
FIG. 4.
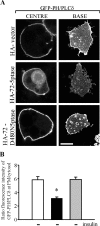
The 72-kDa 5-phosphatase hydrolyzes PtdIns(4,5)P2 in adipocytes. (A) Localization of GFP-PH/PLCδ in the middle or at the base of 3T3-L1 adipocytes cotransfected with the indicated constructs. Representative images are shown. Scale bar, 10 μm. (B) The ratio of the fluorescence intensity of GFP-PH/PLCδ at the PM (average fluorescence intensity of three defined boxes of 5 × 10 pixels of the plasma membrane per cell) to that of the cytosol (average fluorescence intensity of three boxes of a defined area of 10 × 10 pixels per cell) was determined by using Image J software. Bars (empty vector, white bars; wild-type 72-5ptase, black bars; inactive 72-ptase, gray bars) represent mean ± the SEM of two independent experiments (>20 cells scored for each construct for each time point). *, P < 0.01 compared to cells expressing HA-vector or HA-72-D480N5ptase.
FIG. 5.
FIG. 5.
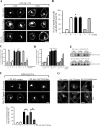
The 72-5ptase promotes insulin-independent GLUT4 translocation. (A) 3T3-L1 adipocytes expressing GFP-GLUT4 and vector, HA-72-5ptase, or HA-72-D480N5ptase were serum starved or stimulated with 100 nM insulin (30 min). Fixed cells were labeled with HA antibody (not shown). GFP-GLUT4 localization is shown. Scale bar, 10 μm. (B) For each experiment 100 cells per transfection were scored for GFP-GLUT4 PM rim fluorescence. Bars (empty vector, white bars; wild-type 72-5ptase, black bars; inactive 72-ptase, gray bars) represent mean percentage ± the SEM from four experiments. *, P < 0.05 compared to same conditions for cells expressing HA-vector or HA-72-D480N5ptase. (C) After serum starvation, adipocytes coexpressing GFP-GLUT4 and HA-vector (white bars), HA-72-5ptase (black bars), or HA-72-D480N5ptase (gray bars) were incubated with (+) or without (−) 100 nM wortmannin (45 min) prior to insulin stimulation (100 nM, 30 min). GFP-GLUT4 rim fluorescence was scored for 100 cells per transfection. Mean values ± the SEM from four independent experiments are shown. *, P < 0.05, compared to same conditions for cells expressing HA-vector or HA-72-D480N5ptase. (D) Adipocytes expressing GFP-GLUT4 and either HA-vector (white bars), HA-72-5ptase (black bars), or HA-72-D480N5ptase (gray bars) were serum starved and treated with 0 to 10 nM insulin (30 min). Mean percentage values of GFP-GLUT4 rim fluorescence ± the SEM were determined for four independent experiments scoring 100 cells for each transfection. *, P < 0.05, compared to same conditions for cells expressing HA-vector or HA-72-D480N5ptase. (E) PM, low-density microsome (LDM), and high-density microsome (HDM) fractions from resting or insulin-stimulated adipocytes cotransfected with GFP-GLUT4 and HA-72-5ptase or HA-vector were immunoblotted with GFP antibody to detect GFP-GLUT4. (F) Unstimulated 3T3-L1 adipocytes coexpressing GFP-GLUT4 and HA-vector or HA-72-5ptase, and FLAG-2xFYVE/Hrs (or empty vector) were labeled with HA- and FLAG-specific antibodies (not shown). GFP-GLUT4 localization is shown. GFP-GLUT4 PM rim fluorescence in transfected adipocytes was scored for 50 cells per transfection. Bars represent mean percentage ± the SEM from at least three independent transfections expressing empty vector (white bars) or wild-type 72-5ptase at high levels (black bars), or cells coexpressing GFP-GLUT4 with moderate levels of HA-72-5ptase (striped gray bars), in the absence (−) or presence (+) of FLAG-2xFYVE/Hrs. *, P < 0.05 compared to same conditions for cells expressing HA-vector or HA-72-D480N5ptase. (G) Serum-starved adipocytes transfected with HA-vector, HA-72-5ptase, or HA-72-D480N5ptase were left untreated or stimulated with 100 nM insulin (30 min) and then labeled with polyclonal GLUT1-specific antibody. Representative images shown from two separate experiments. Scale bar, 10 μm.
FIG. 6.
FIG. 6.
The 72-5ptase promotes insertion of GLUT4 into the PM. (A) Plasma membrane sheets, prepared from serum starved or insulin-stimulated adipocytes cotransfected with the indicated constructs, were analyzed by indirect immunofluorescence using FLAG or GLUT4 antibodies. Scale bar, 10 μm. (B) The percentage of Ras-positive sheets demonstrating GLUT4 staining was determined, and the mean ± the SEM of four independent transfections scoring 100 sheets are shown (empty vector, white bars; wild-type 72-5ptase, black bars; inactive 72-5ptase, gray bars). *, P < 0.05 compared to same conditions for cells coexpressing empty vector or HA-72-D480N5ptase. (C) At 48 h posttransfection, cells were serum starved, before stimulation with 100 nM insulin (30 min). Fixed and unpermeabilized adipocytes expressing exofacial Myc-GLUT4-GFP and the indicated constructs were analyzed by indirect immunofluorescence using monoclonal Myc antibody. Scale bar, 10 μm. (D) The percentage of GFP-expressing cells displaying Myc PM staining ± the SEM, from three independent transfections, was determined for each construct, scoring 100 cells per transfection. *, P < 0.05 compared to same conditions for cells expressing empty vector or HA-72-D480N5ptase. (E) Lysates of adipocytes transduced with the indicated vector as for 2[3H]deoxyglucose uptake assays, were immunoblotted with GFP or HA antibodies. Indirect immunofluorescence demonstrated >60% of cells exposed to adenovirus were transduced with the desired construct (not shown). (F) Adipocytes transduced with vector containing GFP reporter alone (white bars), GFP+HA-72-5ptase (black bars), or GFP+HA-72-D480N5ptase (gray bars) were assayed for 2[3H]deoxyglucose uptake. Bars represent mean disintegrations per minute (dpm) ± the SEM calculated for each condition from four independent infections.
FIG. 7.
FIG. 7.
Sequestration of actin monomers decreases 72-5ptase-mediated GLUT4 trafficking. (A) 3T3-L1 adipocytes were transfected with the indicated constructs and labeled with Texas Red-phalloidin. Representative images of single optical sections through the center or base of transfected cells are shown. Scale bar, 10 μm. (B) Serum-starved adipocytes transfected with GFP-GLUT4 and HA-empty vector (white bars), or wild-type HA-72-5ptase (black bars), were left untreated or pretreated with 50 μM cytochalasin D, or 25 μg of latrunculin A/ml prior to stimulation with insulin. Cotransfected cells were scored for GFP-GLUT4 plasma membrane fluorescence, with 100 cells examined per transfection. Mean percentage values ± the SEM from three independent experiments are shown. *, P < 0.05 compared to nonstimulated untreated cells expressing wild-type 72-5ptase.
FIG. 8.
FIG. 8.
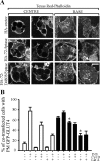
Rab11 regulates 72-5ptase-mediated GLUT4 trafficking. (A) Serum-starved adipocytes transfected with HA-vector or HA-72-5ptase were incubated with Texas Red-transferrin (20 μg/ml) for 1 h at 16°C to facilitate uptake and accumulation in early endosomes. Chase was initiated by shift to 37°C for 5 min in the presence of holotransferrin (200 μg/ml). Scale bar, 10 μm. (B) Adipocytes coexpressing GFP-Rab5(Q79L) and HA-vector (white bars), HA-72-5ptase (black bars), or HA-D480N5ptase (gray bars) were serum starved (2 h) prior to insulin stimulation (100 nM, 30 min). Fixed cells were labeled with GLUT4-specific antibody and GFP-positive cells were scored for positive PM GLUT4 fluorescence. HA staining was performed separately to confirm transfection efficiency. *, P < 0.05 compared to the same conditions for cells expressing HA-vector or HA-72-D480N5ptase. (C) Adipocytes coexpressing Xpress-tagged Rab11(S25N) and GFP-GLUT4, and HA-vector (white bars), HA-72-5ptase (black bars), or HA-D480N5ptase (gray bars) were serum starved prior to insulin stimulation (100 nM, 30 min). For panels B and C, bars represent the mean percentages of cotransfected cells displaying PM GFP-GLUT4 or positive GLUT4 labeling ± the SEM from three independent transfections for each construct, in which 100 cells were scored are shown. *, P < 0.05 compared to unstimulated HA-72-5ptase-transfected cells not coexpressing Rab11(S25N). (D) Serum-starved adipocytes expressing GFP-GLUT4 and HA-vector (white bars), HA-72-5ptase (black bars), or HA-72-D480N5ptase (gray bars) were treated with brefeldin A (BFA) (10 mg/ml) prior to insulin stimulation. Cotransfected cells were scored for GFP-GLUT4 fluorescence with 100 cells examined per transfection. Mean percentages ± the SEM from three independent experiments are shown. *, P < 0.05 compared to same conditions for cells expressing HA-vector or HA-72-D480N5ptase.

Similar articles

Cited by

References

    1. Abramoff, M., P. Magelhaes, and S. Ram. 2004. Image processing with Image J. Biophotonics Int. 11:36-42.
    1. Al-Hasani, H., C. S. Hinck, and S. W. Cushman. 1998. Endocytosis of the glucose transporter GLUT4 is mediated by the GTPase dynamin. J. Biol. Chem. 273:17504-17510. - PubMed
    1. Asano, T., A. Kanda, H. Katagiri, M. Nawano, T. Ogihara, K. Inukai, M. Anai, Y. Fukushima, Y. Yazaki, M. Kikuchi, R. Hooshmand-Rad, C. H. Heldin, Y. Oka, and M. Funaki. 2000. p110beta is up-regulated during differentiation of 3T3-L1 cells and contributes to the highly insulin-responsive glucose transport activity. J. Biol. Chem. 275:17671-17676. - PubMed
    1. Asano, T., Y. Mochizuki, K. Matsumoto, T. Takenawa, and T. Endo. 1999. Pharbin, a novel inositol polyphosphate 5-phosphatase, induces dendritic appearances in fibroblasts. Biochem. Biophys. Res. Commun. 261:188-195. - PubMed
    1. Backer, J. M. 2000. Phosphoinositide 3-kinases and the regulation of vesicular trafficking. Mol. Cell. Biol. Res. Commun. 3:193-204. - PubMed

Publication types

MeSH terms

LinkOut - more resources