. 2006 Aug;128(2):231-46.
doi: 10.1085/jgp.200509465.

Control of single channel conductance in the outer vestibule of the Kv2.1 potassium channel

Affiliations

Control of single channel conductance in the outer vestibule of the Kv2.1 potassium channel

Josef G Trapani et al. J Gen Physiol. 2006 Aug.

Abstract

Current magnitude in Kv2.1 potassium channels is modulated by external [K+]. In contrast to behavior expected from the change in electrochemical driving force, outward current through Kv2.1 channels becomes larger when extracellular [K+] is increased within the physiological range. The mechanism that underlies this unusual property involves the opening of Kv2.1 channels into one of two different outer vestibule conformations, which are defined by their sensitivity to TEA. Channels that open into a TEA-sensitive conformation generate larger macroscopic currents, whereas channels that open into a TEA-insensitive conformation generate smaller macroscopic currents. At higher [K+], more channels open into the TEA-sensitive conformation. In this manuscript, we examined the mechanism by which the conformational change produced a change in current magnitude. We started by testing the simplest hypothesis: that each pharmacologically defined channel conformation produces a different single channel conductance, one smaller and one larger, and that the [K+]-dependent change in current magnitude reflects the [K+]-dependent change in the percentage of channels that open into each of the two conformations. Using single channel and macroscopic recordings, as well as hidden Markov modeling, we were able to quantitatively account for [K+]-dependent regulation of macroscopic current with this model. Combined with previously published work, these results support a model whereby an outer vestibule lysine interferes with K+ flux through the channel, and that the [K+]-dependent change in orientation of this lysine alters single channel conductance by changing the level of this interference. Moreover, these results provide an experimental example of single channel conductance being modulated at the outer end of the conduction pathway by a mechanism that involves channel activation into open states with different outer vestibule conformations.


Figures
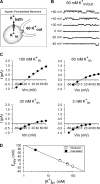
Figure 1.
Figure 1.
Method for recording single channel currents in cell-attached patches. (A) Cartoon of cell-attached patch configuration for recording single channel events. The extracellular bath solution (K+ bath) contained 30 μM nystatin and the desired internal concentration of K+ (K+ in). The pipet solution was the external solution for the patch of membrane containing the channel to be studied, and contained 60 mM K+. With nystatin in the membrane, K+ bath and K+ in equilibrated so that the internal concentration was the same as the bath concentration and the membrane potential, relative to the bath solution, was 0 mV. The potential across the membrane patch containing the channel being recorded was therefore set by the pipet potential. (B) Single channel recordings at a series of different membrane potentials with 60 mM internal and external K+ to produce a reversal potential of 0 mV. Currents open upward at potentials positive to 0 mV and downwards at potentials negative to 0 mV. Single channel currents reversed at 0 mV. (C) Four panels illustrating I-V curves obtained from patches with 60 mM [K+]out and four different K+ in. Solid lines were drawn by hand. (D) Plot of observed reversal potentials (open circles) and those predicted by the Nernst equation (filled circles) for each [K+]in.
Figure 2.
Figure 2.
Outward K+ current magnitude is potentiated by elevation of external [K+]. (A) Outward K+ currents through Kv2.1 channels in 0 and 10 mM K+. Channels were held at −80 mV and depolarized to 0 mV for 200 ms. Note that the outward tail current was associated with 0 mM K+ and the inward tail current was associated with 10 mM K+. (B) Cartoon depicting the two outer vestibule conformations responsible for the increase in macroscopic current magnitude upon elevation of [K+]. The left panel illustrates the Lysin conformation, wherein the outer vestibule lysine (square with plus sign at outer edge of channel) is oriented toward the central axis of the conduction pathway. The right panel depicts the Lysout conformation, with the outer vestibule lysine oriented more away from the central axis of the pore.
Figure 3.
Figure 3.
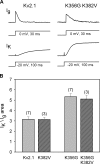
Neutralization of K356 caused a 65% increase in macroscopic conductance in 5 mM external K+. (A, top) On-gating currents from each of two channel types (wt Kv2.1 and Kv2.1 K356G K382V) recorded at 0 mV (the ionic current reversal potential) with 100 mM symmetrical [K+]. (A, bottom) After recording gating currents, external [K+] was changed to 5 mM to record outward ionic currents at −20 mV. (B) Ionic current magnitude, normalized to the area under the gating currents, for wt Kv2.1 and three mutant channels.
Figure 4.
Figure 4.
Neutralization of residue K356 increased single channel conductance by 60%. Main graph: I-V relationship for Kv2.1 (filled circles), the double lysine mutant (open circles), and the single K356G mutant (filled diamonds), obtained from single channel recordings. Current values at multiple membrane potentials were obtained with 100 mM internal and 60 mM external [K+]. The lines represent the best fit of the data between −40 and +40 mV. Traces below graph: representative single channel records for the wild type and double lysine mutant channels, recorded at +60 mV.
Figure 5.
Figure 5.
Indirect determination of single channel conductance for channels in the Lysout conformation (gout[x]). Macroscopic conductance was calculated by passing brief 10-mV voltage pulses superimposed upon the steady depolarization. (A) Cells were first activated in 60 mM K+ so that all channels would open into the Lysout conformation. At the arrow, external [K+] was rapidly switched to a new concentration (in this case 10 mM). For each cell, this protocol gave two macroscopic conductance values, Gtot[60] (before the arrow) and Gtot[x] (after the arrow). (B) Single channel conductance of the Lysout conformation (gout[x]) at different [K+]. The value of gout[60] was obtained directly from single channel recordings (Fig. 4). The other values of gout[x] were calculated as described in the text.
Figure 6.
Figure 6.
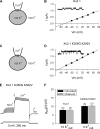
Comparison of calculated and directly measured gout[x]. (A and C) Illustrations of the cell-attached patch setup and [K+] used for experiments described in B and D, respectively. (B) I-V relationship of single Kv2.1 channel currents recorded in 10 mM external K+. The inset illustrates a representative trace at +60 mV. (D) Same as in B but for the mutant channel Kv2.1 K356G K382V. (E) Representative recording from the double mutant channel to obtain Gtot[60] and Gtot[x], as in Fig. 5. In this example, at the arrow, external [K+] was changed from 60 mM to 5 mM. (F) Comparison of single channel conductance values obtained from calculations (black bars) and direct measurements of unitary currents (gray bars) for Kv2.1 and the double lysine mutant.
Figure 7.
Figure 7.
Determination of GTEA-I[x]. (A) Channels were initially opened in 60 mM external K+ to provide Gtot[60]. 100 mM TEA was applied and blocked the majority of channels. Because all channels open into the Lysout conformation in 60 mM external K+, the macroscopic conductance that remained after TEA application reflected the percentage of unblocked Lysout channels. TEA was then removed and total conductance allowed to recover (not depicted). (B) In the same cell, channels were then opened in x mM external [K+] to provide Gtot[x] (in this panel, x = 0 mM). 100 mM TEA was then applied in this subsaturating [K+]. In this case, GTEA-I[x], the conductance remaining after TEA block, was composed of unblocked Lysout channels plus all of the Lysin channels. For clarity, the insets illustrate the boxed portion of the current recorded in 100 mM TEA in an expanded scale.
Figure 8.
Figure 8.
Measured potentiation of macroscopic conductance with elevation of [K+]. (A) Channels were first opened in 0 mM K+, closed, and reopened in 10 mM K+. (B) Channels were first opened in 0 mM K+, closed, and reopened in 3 mM K+. (C) Channels were first opened in 3 mM K+, closed, and reopened in 60 mM K+.
Figure 9.
Figure 9.
Measured changes in macroscopic currents with elevation of [K+]. (A) Outward current was evoked in 10 mM external [K+] by depolarization to 0 mV. Channels were then closed and reopened in 60 mM [K+]. (B) Same as in A except that currents were recorded at +50 mV and external [K+] was changed from 3 to 10 mM. (C) Same as in B except that external [K+] was changed from 10 to 60 mM.
Figure 10.
Figure 10.
HMM analysis of single channel recordings in 0 mM external [K+]. (A, top) Representative current trace (600 ms duration) from a recording at 0 mV. Channel openings are illustrated as going in the upward direction. The solid horizontal lines are placed 0.8 pA apart and correspond to the histogram limits (see D) for detection of the large visible event with HMM. (A, bottom) The initial 300 ms of the upper trace is expanded to illustrate with higher resolution the noise, which might contain small hidden events. The dashed lines correspond to the histogram limits (see E and F) for detection of hidden small events. (B) I-V plots of the large directly observed events (black circles) and HMM detected small hidden events (gray squares; from histograms in E and F). The data from large events were best fit with a slope conductance of 5.55 ± 0.48 pS (solid line), which compares well with the calculated value for the Lysout conformation (dashed line; Table I). The data from small hidden events were best fit by a line with a slope conductance of 1.13, which is identical to that predicted in Table I. (C) Comparison of the current magnitude of large events, recorded in 0 mM external K+, determined from direct measurement of unitary events (black bar) and HMM detection of large unitary events (gray bar). (D) Histogram generated by HMM analysis of concatenated traces including portion shown in A (top). Two peaks were found: the peak at 0 pA corresponded to the channel closed current level, the peak (arrow) at 0.38 pA corresponded to the amplitude of the large events (Lysout). Note that small state events were potentially present but hidden within the large 0 pA histogram peak. (E) To perform HMM analysis with higher resolution, the noisy portion of the entire concatenated record was expanded (see lower part of A), boundary cursors were placed as shown in dashed lines in A, and the large visible opening events were deleted from the record. HMM analysis yielded a histogram with a peak at 0.075 pA (arrow) corresponding to the small hidden events. (F) Same as in E but channel activity was recorded at +40 mV. HMM analysis detected small hidden events with an average current level of 0.12 pA (arrow).
Figure 11.
Figure 11.
Conductance ratio of small and large conductance events. (A) Single channel current magnitude was determined with 10 mM external [K+] at +40 mV. The black bar plots the current magnitude of large, directly observed unitary events. The gray bar plots the current magnitude of small, hidden events detected by HMM analysis. (B) Graph of conductance ratios at different external [K+]. Gray bars plot the ratio obtained from the calculated values in Table I. The black bar plots the ratio obtained from the experimentally obtained slope conductances in Fig. 10 B. The hatched bar plots the experimentally obtained ratio from A of this figure.

Similar articles

Cited by

References

    1. Andalib, P., M.J. Wood, and S.J. Korn. 2002. Control of outer vestibule dynamics and current magnitude in the Kv2.1 potassium channel. J. Gen. Physiol. 120:739–755. - PMC - PubMed
    1. Bao, H., A. Hakeem, M. Henteleff, J.G. Starkus, and M.D. Rayner. 1999. Voltage-insensitive gating after charge-neutralizing mutations in the S4 segment of Shaker channels. J. Gen. Physiol. 113:139–151. - PMC - PubMed
    1. Barry, D.M., J.S. Trimmer, J.P. Merlie, and J.M. Nerbonne. 1995. Differential expression of voltage-gated K+ channel subunits in adult rat heart. Relation to functional K+ channels? Circ. Res. 77:361–369. - PubMed
    1. Bernèche, S., and B. Roux. 2001. Energetics of ion conduction through the K+ channel. Nature. 414:73–77. - PubMed
    1. Brelidze, T.I., and K.L. Magleby. 2005. Probing the geometry of the inner vestibule of BK channels with sugars. J. Gen. Physiol. 126:105–121. - PMC - PubMed

Publication types

MeSH terms