Intraoperative detection of cell injury and cell death with an 800 nm near-infrared fluorescent annexin V derivative
- PMID: 16869796
- PMCID: PMC2486409
- DOI: 10.1111/j.1600-6143.2006.01469.x
Intraoperative detection of cell injury and cell death with an 800 nm near-infrared fluorescent annexin V derivative
Abstract
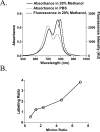
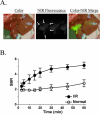
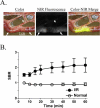
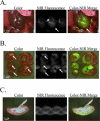
The intraoperative detection of cell injury and cell death is fundamental to human surgeries such as organ transplantation and resection. Because of low autofluorescence background and relatively high tissue penetration, invisible light in the 800 nm region provides sensitive detection of disease pathology without changing the appearance of the surgical field. In order to provide surgeons with real-time intraoperative detection of cell injury and death after ischemia/reperfusion (I/R), we have developed a bioactive derivative of human annexin V (annexin800), which fluoresces at 800 nm. Total fluorescence yield, as a function of bioactivity, was optimized in vitro, and final performance was assessed in vivo. In liver, intestine and heart animal models of I/R, an optimal signal to background ratio was obtained 30 min after intravenous injection of annexin800, and histology confirmed concordance between planar reflectance images and actual deep tissue injury. In summary, annexin800 permits sensitive, real-time detection of cell injury and cell death after I/R in the intraoperative setting, and can be used during a variety of surgeries for rapid assessment of tissue and organ status.
Figures


Similar articles
-
Real-time intraoperative ureteral guidance using invisible near-infrared fluorescence.J Urol. 2007 Nov;178(5):2197-202. doi: 10.1016/j.juro.2007.06.049. Epub 2007 Sep 17. J Urol. 2007. PMID: 17870110 Free PMC article.
-
Diannexin, a novel annexin V homodimer, provides prolonged protection against hepatic ischemia-reperfusion injury in mice.Gastroenterology. 2007 Aug;133(2):632-46. doi: 10.1053/j.gastro.2007.05.027. Epub 2007 May 21. Gastroenterology. 2007. PMID: 17681182
-
Real-time assessment of in vivo renal ischemia using laser autofluorescence imaging.J Biomed Opt. 2005 Jul-Aug;10(4):44018. doi: 10.1117/1.1993327. J Biomed Opt. 2005. PMID: 16178651
-
Annexin V assay-proven anti-apoptotic effect of ascorbic acid 2-glucoside after cold ischemia/reperfusion injury in rat liver transplantation.Acta Med Okayama. 2003 Oct;57(5):209-16. doi: 10.18926/AMO/32828. Acta Med Okayama. 2003. PMID: 14679398
-
Regulation of autophagy protects against liver injury in liver surgery-induced ischaemia/reperfusion.J Cell Mol Med. 2021 Nov;25(21):9905-9917. doi: 10.1111/jcmm.16943. Epub 2021 Oct 8. J Cell Mol Med. 2021. PMID: 34626066 Free PMC article. Review.
Cited by
-
In Vitro and In Vivo Fluorescence Imaging of Antibody-Drug Conjugate-Induced Tumor Apoptosis Using Annexin V-EGFP Conjugated Quantum Dots.ACS Omega. 2022 Jan 3;7(2):2105-2113. doi: 10.1021/acsomega.1c05636. eCollection 2022 Jan 18. ACS Omega. 2022. PMID: 35071899 Free PMC article.
-
Molecular imaging metrics to evaluate response to preclinical therapeutic regimens.Front Biosci (Landmark Ed). 2011 Jan 1;16(2):393-410. doi: 10.2741/3694. Front Biosci (Landmark Ed). 2011. PMID: 21196177 Free PMC article. Review.
-
Targeted imaging of myocardial damage.Nat Clin Pract Cardiovasc Med. 2008 Aug;5 Suppl 2(Suppl 2):S63-70. doi: 10.1038/ncpcardio1115. Nat Clin Pract Cardiovasc Med. 2008. PMID: 18641609 Free PMC article. Review.
-
The FLARE intraoperative near-infrared fluorescence imaging system: a first-in-human clinical trial in breast cancer sentinel lymph node mapping.Ann Surg Oncol. 2009 Oct;16(10):2943-52. doi: 10.1245/s10434-009-0594-2. Epub 2009 Jul 7. Ann Surg Oncol. 2009. PMID: 19582506 Free PMC article. Clinical Trial.
-
Shortwave-infrared (SWIR) emitting annexin V for high-contrast fluorescence molecular imaging of tumor apoptosis in living mice.RSC Adv. 2022 Jul 6;12(30):19632-19639. doi: 10.1039/d2ra03315a. eCollection 2022 Jun 29. RSC Adv. 2022. PMID: 35865555 Free PMC article.
References
-
- Gustafsson AB, Gottlieb RA. Mechanisms of apoptosis in the heart. J Clin Immunol. 2003;23(6):447–459. - PubMed
-
- de Perrot M, Liu M, Waddell TK, Keshavjee S. Ischemia-reperfusion-induced lung injury. Am J Respir Crit Care Med. 2003;167(4):490–511. - PubMed
-
- Jaeschke H. Molecular mechanisms of hepatic ischemia-reperfusion injury and preconditioning. Am J Physiol Gastrointest Liver Physiol. 2003;284(1):G15–26. - PubMed
-
- Sakorafas GH, Tsiotos GG, Sarr MG. Ischemia/Reperfusion-Induced pancreatitis. Dig Surg. 2000;17(1):3–14. - PubMed
-
- Mallick IH, Yang W, Winslet MC, Seifalian AM. Ischemia-reperfusion injury of the intestine and protective strategies against injury. Dig Dis Sci. 2004;49(9):1359–1377. - PubMed
Publication types
MeSH terms
Substances
Grants and funding
LinkOut - more resources
Full Text Sources
Other Literature Sources

