. 2006 Aug;26(15):5850-60.
doi: 10.1128/MCB.01854-05.

A distant upstream locus control region is critical for expression of the Kit receptor gene in mast cells

Affiliations

A distant upstream locus control region is critical for expression of the Kit receptor gene in mast cells

Georgina Berrozpe et al. Mol Cell Biol. 2006 Aug.

Abstract

The Kit receptor tyrosine kinase functions in hematopoiesis, melanogenesis, and gametogenesis and in interstitial cells of Cajal. We previously identified two upstream hypersensitive site (HS) clusters in mast cells and melanocytes. Here we investigated the roles of these 5' HS sequences in Kit expression using transgenic mice carrying Kit-GFP reporter constructs. In these mice there is close correspondence between Kit-GFP reporter and endogenous Kit gene expression in most tissues analyzed. Deletion analysis defined the 5' upstream HS cluster region as critical for Kit expression in mast cells. Furthermore, chromatin immunoprecipitation analysis in mast cells showed that H3 and H4 histone hyperacetylation and RNA polymerase II recruitment within the Kit promoter and in the 5' HS region were associated with Kit expression. Therefore, the 5' upstream hypersensitivity sites appear to be critical components of locus control region-mediated Kit gene activation in mast cells.


Figures

FIG. 1.
FIG. 1.
Derivation of transgenic mice carrying BAC-Kit-GFP reporter constructs. (A) Schematic representation of the mouse Kit locus. Black arrowheads above the locus indicate the positions of the mast cell HS clusters. Arrows below the locus show the localization of the mast cell-specific HSs (black) and melanocyte-specific HSs (gray). (B) A GFP reporter was placed at the Kit translation start site in exon 1 of the BAC RP23-232H18 (BAC200-Kit-GFP). The BAC200-Kit-GFP construct includes 200 kb 5′ upstream sequences and 60-kb Kit coding sequences. Arrows indicate the positions of the 5′ and 3′ HS clusters. The BAC30-Kit-GFP and BAC3-Kit-GFP constructs include 30 and 3 kb of 5′ upstream sequences of the Kit gene, respectively. In BAC2005HS-Kit-GFP, the 5′ HS cluster sequences (7 kb) were deleted. (C) Determination of transgene copy numbers by Southern blot analysis in transgenic mice carrying the four different constructs. DNA from cerebellum was digested with SpeI and hybridized with a probe located at the 5′ end of the BAC-RP23-232H18. The transgenic lines carrying the different constructs are indicated. (D) Copy number-dependent expression of the GFP transgene. The ratios of the DNA signals of the GFP transgene versus endogenous Kit gene were determined with a phosphorimager and are represented in the histogram by black bars. Error bars represent the standard deviations from three independent Southern analyses. The ratios of GFP RNA versus endogenous Kit RNA expression levels in BMMC (BAC200-Kit-GFP mice) and in cerebellum (BAC30-Kit-GFP, BAC3-Kit-GFP, and BAC2005HS-Kit-GFP) were determined with a phosphorimager. GFP expression levels are shown as white bars.
FIG. 2.
FIG. 2.
GFP reporter expression in BAC-Kit-GFP transgenic mice. (A) RNase protection assay. Total RNA from cerebellum, testis, ovary, and liver (as indicated) of BAC200-Kit-GFP, BAC30-Kit-GFP, BAC3-Kit-GFP, and BAC2005HS-Kit-GFP transgenic mice was processed for RNase protection assay using 32P-labeled riboprobes specific for GFP and endogenous Kit RNA. Analysis of Kit-GFP and endogenous Kit expression in BMMC from T20, T91, and T127 BAC200-Kit-GFP mice by RNase protection and FACS analysis is shown. Mean values of fluorescence are indicated. Max, maximum. (B) Immunohistochemical detection of Kit-GFP transgene expression with anti-GFP antibody (signal in brown; hematoxylin counterstain in blue). Oocytes in the control ovary have no signal, while in the BAC200-Kit-GFP transgenic ovary, oocytes are stained in brown (red arrows). Representative sections of testis and cerebellum from nontransgenic and BAC200-Kit-GFP, BAC30-Kit-GFP, BAC3-Kit-GFP, and BAC2005HS-Kit-GFP transgenic mice are shown. In the testis, Kit-GFP expression is found in spermatogonia (red arrow), and white stars show GFP expression in Leydig cells. The molecular layer (m) of the cerebellum shows staining in basket and stellate cell bodies as well as axons and dendrites. In addition, the molecular layer neurons form brown baskets around Purkinje cell bodies (p). Confocal microscopy identifies primordial germ cells in the mesentery and the gonadal ridge of E11.5 BAC200-Kit-GFP mouse embryos (red arrow).
FIG. 3.
FIG. 3.
Kit-GFP reporter expression in mast cells and melanocytes in P4 back skin of BAC200-Kit-GFP (T20) and BAC2005HS-Kit-GFP transgenic mice (T92). Cell suspensions of dorsal skin were stained with APC-conjugated anti-Kit and anti-CD45 antibodies, and cells were analyzed by FACS on the basis of Kit, CD45, and GFP expression. In the bar graph, the numbers of Kit+ CD45+ (mast cell subset) and Kit+ CD45 (melanocyte subset) cells expressing Kit-GFP from BAC2005HS-Kit-GFP mice relative to the numbers of Kit-GFP expressing Kit+ CD45+ and Kit+ CD45 cells from BAC200-Kit-GFP mice are shown. The standard deviations are indicated by the error bars (n = 3).
FIG. 4.
FIG. 4.
Representative flow cytometric analysis of GFP expression in bone marrow progenitor cells (BM) and in bone marrow-derived mast cells of BAC200-Kit-GFP (T20), BAC30-Kit-GFP (T93), BAC3-Kit-GFP (T29), and BAC2005HS-Kit-GFP transgenic mice (T92). (A) BM cells were stained with PE-conjugated anti-Lin and APC-conjugated anti-Kit antibodies, and cells within the lin gate were analyzed on the basis of Kit and GFP expression. Only a small fraction (13%) of the Kit+ cells expressed the GFP in the BAC200-Kit-GFP transgenic mice. No GFP expression was found in lin Kit+ BM cells of BAC30-Kit-GFP, BAC3-Kit-GFP, and BAC2005HS-Kit-GFP transgenic mice in all the transgenic lines analyzed. BMMC were stained with APC-conjugated anti-Kit antibody and analyzed for Kit and GFP expression. Expression of the GFP reporter was detected only in the BMMC of the BAC200-Kit-GFP transgenic mice. (B) Kit+ GFP+ and Kit+ GFP lin Kit+ BM cells from BAC200-Kit-GFP transgenic mice were sorted by FACS. After 3 weeks of culture in IL-3-containing medium, only the Kit+ GFP cells gave rise to BMMC expressing the GFP transgene. Kit+ GFP+ cells die after 3 days in culture.
FIG. 5.
FIG. 5.
Analysis of histone H3 and H4 acetylation in the chromatin of the 5′ HS cluster region. Formaldehyde-cross-linked chromatin obtained from WT (+/+) BMMC, Wsh/Wsh BMMC, 32D cells, and lin Kit+ BM cells was immunoprecipitated with antibodies directed against acetylated forms of histones H3 and H4, and the amount of the immunoprecipitated and input DNA was assayed by semiquantitative PCR. A schematic representation of the Kit locus is shown at the top. The positions of the different PCR amplification units (P1 to P9) on the 7-kb SacI fragment are indicated by horizontal bars. The ratios of signals of bound versus input chromatin were determined with a phosphorimager and are represented in the histogram. The error bars represent the standard deviations from three independent ChIP experiments.
FIG. 6.
FIG. 6.
Analysis of histone H3 and H4 acetylation in the chromatin of the proximal Kit promoter and the GFP reporter gene. A schematic representation of the endogenous Kit promoter and the transgene constructs is shown at the top. The positions of the different PCR amplification units A1 (−449 to −289), A2 (−247 to +63 of GFP), and A3 (GFP) are indicated by horizontal bars. Formaldehyde-cross-linked chromatin obtained from WT (+/+) BMMC, Wsh/Wsh BMMC, 32D cells, lin Kit+ BM cells, and BMMC derived from BAC200-Kit-GFP (T20)/Wsh/Wsh, BAC30-Kit-GFP (T51)/Wsh/Wsh, and BAC2005HS-Kit-GFP (T78) mice was immunoprecipitated with antibodies against acetylated forms of histones H3 and H4, and the amount of the immunoprecipitated and input DNA was assayed by semiquantitative PCR. The ratios of signals of bound versus input chromatin were determined with a phosphorimager and are represented in the histogram. The error bars represent the standard deviations from three independent ChIP experiments.
FIG. 7.
FIG. 7.
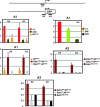
Recruitment of RNA polymerase II to the chromatin of the 5′ HS cluster and in the Kit promoter region. A schematic representation of the Kit locus and the transgene constructs is shown at the top. The positions of the different PCR amplification units A2 (−247 to +63 of GFP), A4 (−247 to +37), and A5 (−247 to +3) and P1, P3, P4, P6, P7, P8, and P9 used for quantitation are indicated by horizontal bars. Formaldehyde-cross-linked chromatin obtained from WT (+/+) BMMC, Wsh/Wsh BMMC, 32D cells, and BMMC derived from BAC200-Kit-GFP (T20)/Wsh/Wsh, BAC30-Kit-GFP (T51)/Wsh/Wsh, and BAC2005HS-Kit-GFP (T78) mice was immunoprecipitated with antibodies against RNA polymerase II, and the amount of immunoprecipitated and input DNA was assayed by semiquantitative PCR. The ratios of signals of bound versus input chromatin were determined with a phosphorimager and are represented in the histogram. The error bars represent the standard deviations from three independent ChIP experiments.

Similar articles

Cited by

References

    1. Agosti, V., S. Corbacioglu, I. Ehlers, C. Waskow, G. Sommer, G. Berrozpe, H. Kissel, C. M. Tucker, K. Manova, M. A. Moore, H. R. Rodewald, and P. Besmer. 2004. Critical role for Kit-mediated Src kinase but not PI 3-kinase signaling in pro T and pro B cell development. J. Exp. Med. 199:867-878. - PMC - PubMed
    1. Bachvarova, R. F., K. Manova, and P. Besmer. 1993. Role in gametogenesis of c-kit encoded at the W locus of mice. Wiley-Liss, New York, N.Y.
    1. Bedell, M. A., N. A. Jenkins, and N. G. Copeland. 1996. Good genes in bad neighbourhoods. Nat. Genet. 12:229-232. - PubMed
    1. Berrozpe, G., I. Timokhina, S. Yukl, Y. Tajima, M. Ono, A. D. Zelenetz, and P. Besmer. 1999. The W(sh), W(57), and Ph Kit expression mutations define tissue-specific control elements located between −23 and −154 kb upstream of Kit. Blood 94:2658-2666. - PubMed
    1. Besmer, P. 1997. Kit-ligand-stem cell factor. Marcel Dekker, New York, N.Y.

Publication types

MeSH terms