. 2006 Jun 28;26(26):6911-23.
doi: 10.1523/JNEUROSCI.0505-06.2006.

Heparan sulphation patterns generated by specific heparan sulfotransferase enzymes direct distinct aspects of retinal axon guidance at the optic chiasm

Affiliations

Heparan sulphation patterns generated by specific heparan sulfotransferase enzymes direct distinct aspects of retinal axon guidance at the optic chiasm

Thomas Pratt et al. J Neurosci. .

Abstract

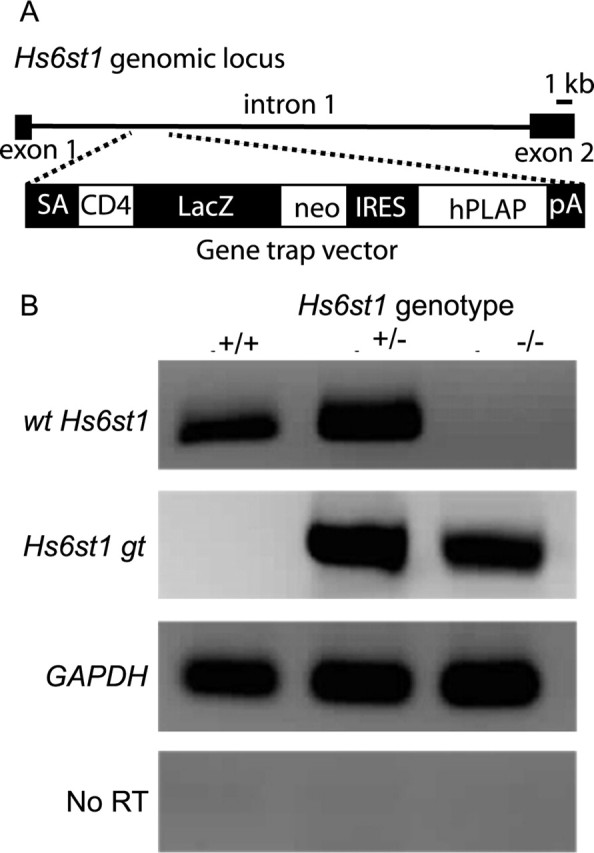
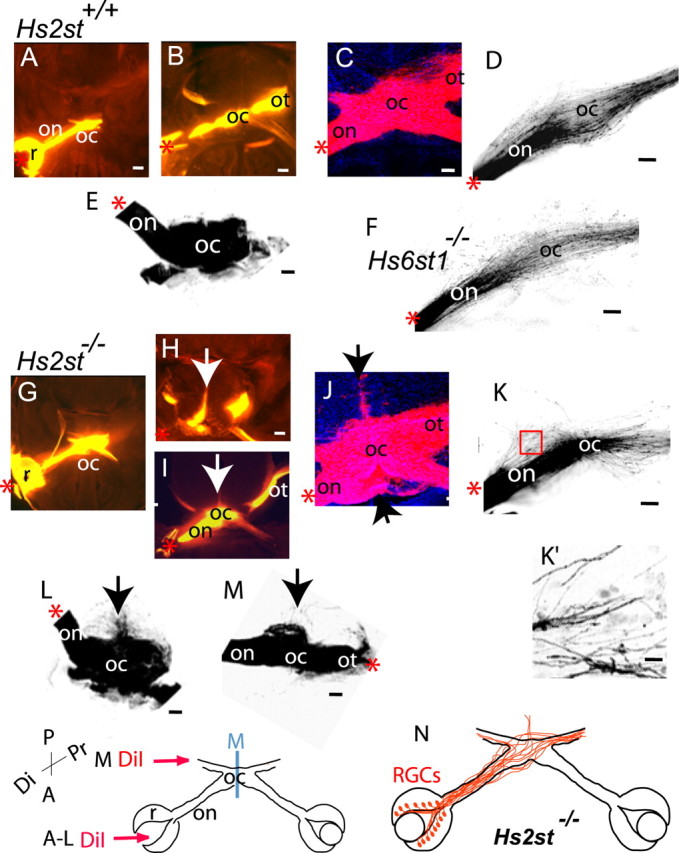
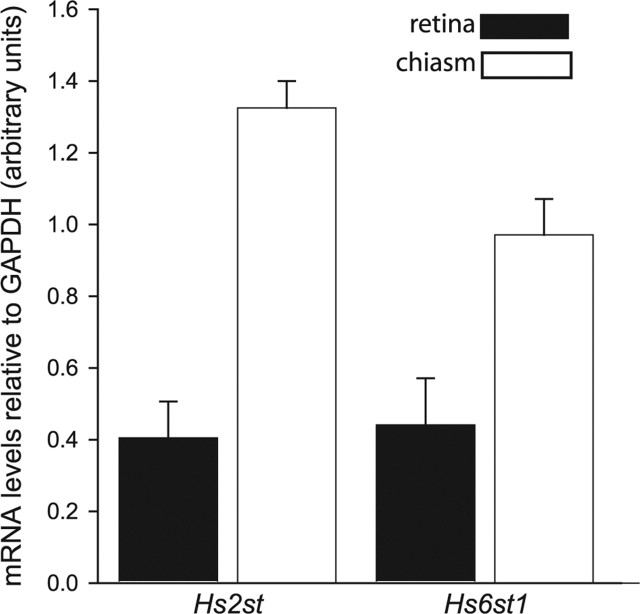
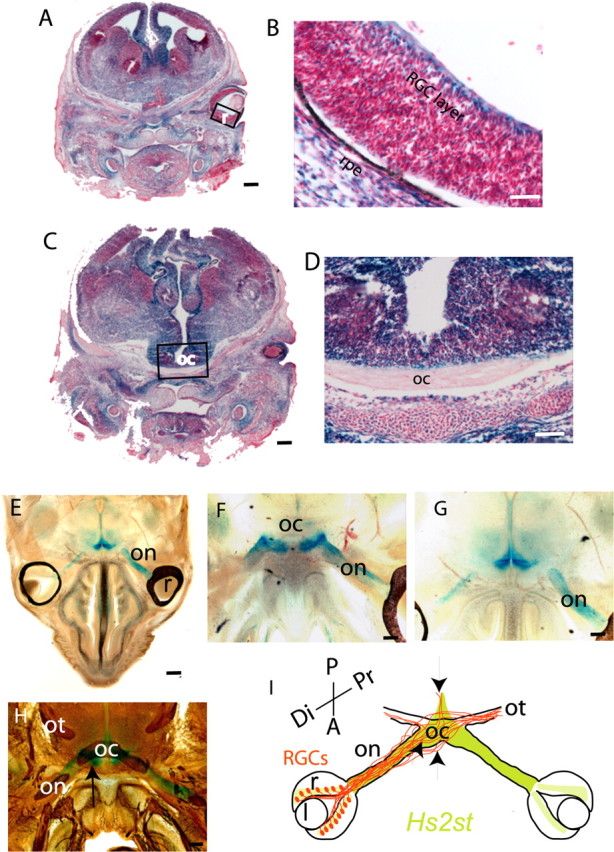
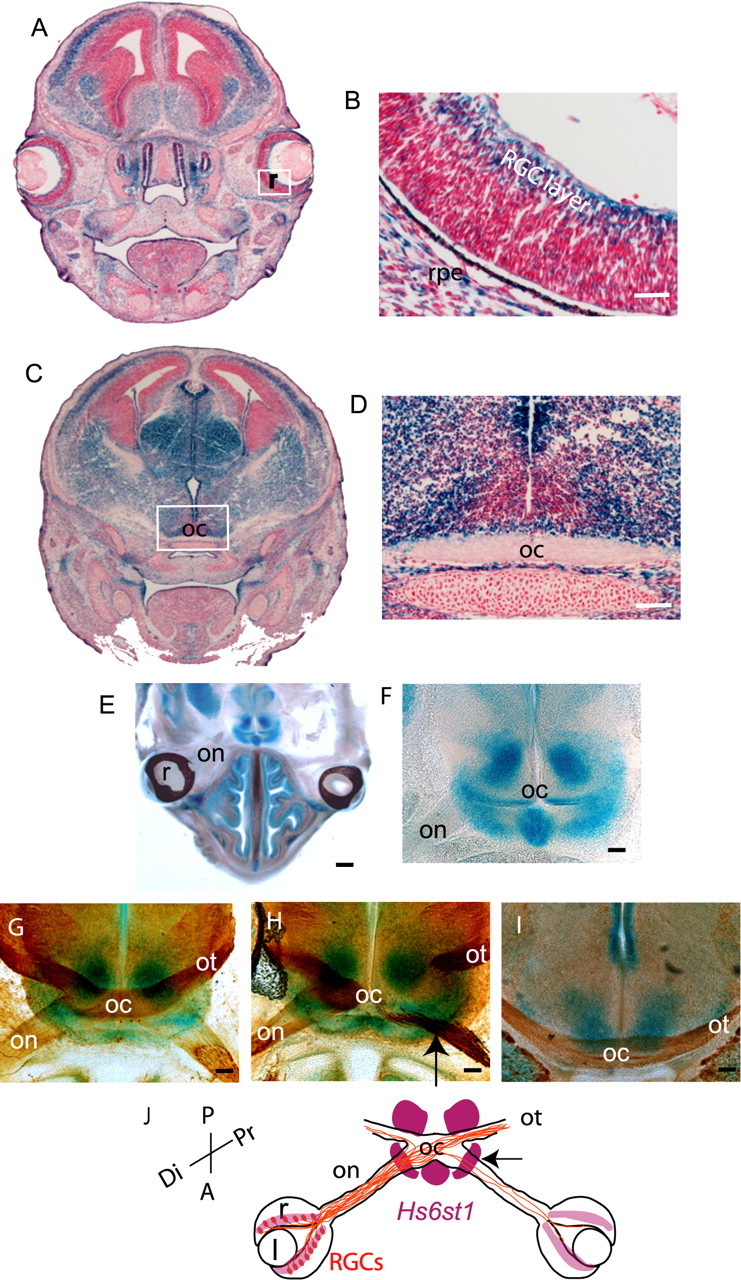
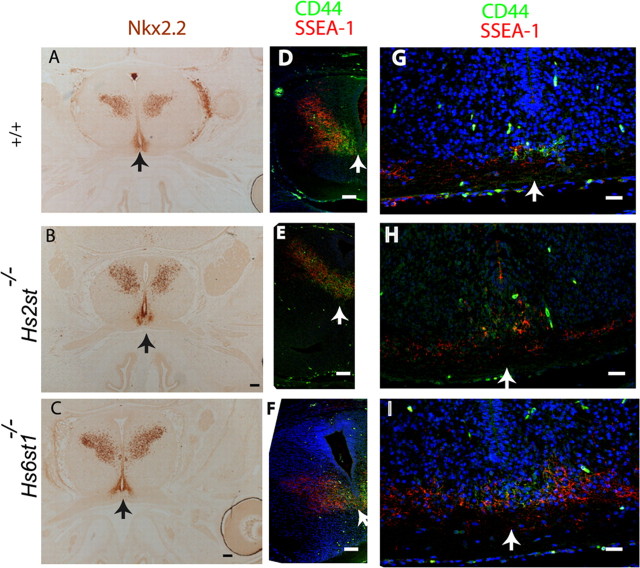
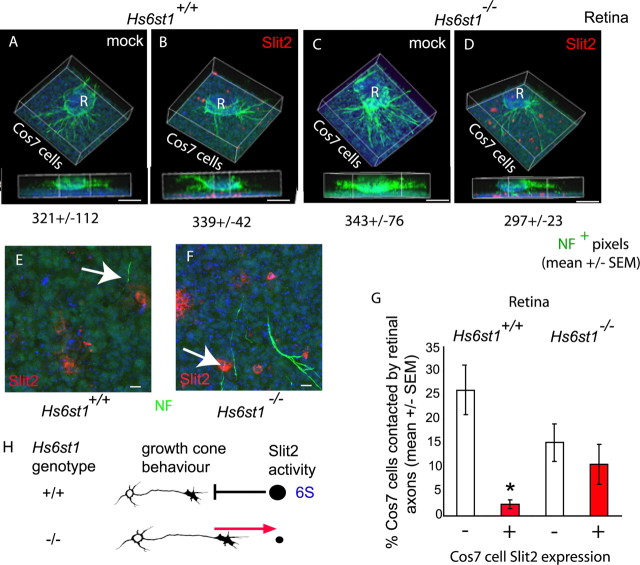
Retinal ganglion cell (RGC) axons from each eye execute a series of maneuvers as they converge on the ventral surface of the brain at the optic chiasm for sorting into the optic tracts. Heparan sulfate proteoglycans (HSPGs) are extracellular glycoproteins involved in cell-surface interactions. HSPGs exhibit massive structural diversity, conferred partly by extensive post-translational modification including differential sulfation. Here we examine the roles of HSPG sulfation in RGC axon guidance at the chiasm. We identified different axon navigation phenotypes in two heparan sulfate sulfotransferase (Hst) mutant embryos, Hs2st-/- and Hs6st1-/-, each lacking an enzyme that catalyzes a particular HSPG modification. Hs2st-/- embryos display axon disorganization at the chiasm. Hs6st1-/- embryos exhibit prolific inter-retinal innervation. We show that RGCs express Hs2st and Hs6st1 and that navigation errors made by their axons coincide with regions of high Hs2st and/or Hs6st1 expression at the chiasm. Slit proteins are expressed at particular locations in the retina and around the chiasm and are normally deployed to prevent axons entering inappropriate territories. We show that Hs2st and/or Hs6st1 expression coincides with Slit expression domains at locations where RGC axons make navigation errors in Hs2st-/- and Hs6st1-/- mutants and that Hs6st1-/- RGC axons are less sensitive to Slit2 repulsion than their wild-type counterparts in vitro. We suggest that (1) Hs2st and Hs6st1 are each deployed to generate distinct patterns of heparan sulfation on RGCs and at the optic chiasm and (2) this differential sulfation directs retinal axons through the chiasm, at least in part by modulating the response of the navigating growth cone to Slit proteins.


Figures

Figure 1.
Figure 1.
Molecular characterization of the Hs6st1 gene-trap allele. A, In mouse, the Hs6st1 gene is found on chromosome 1 and is composed of 2 exons. The gene-trap vector is composed of a splice acceptor (SA), an ORF encoding a CD4 transmembrane domain (CD4), a LacZ/neomycin (neo) fusion cassette, and an IRES and PLAP coding region followed by a polydenylation sequence (pA). B, RT-PCR analysis of Hs6st1 gene expression in wild-type, heterozygous, and homozygous mutant embryos using primers specific to the wt Hs6st1, the Hs6st1 gt, and GAPDH transcripts. Included is a no-RT control using GAPDH primers.
Figure 2.
Figure 2.
Embryos lacking Hs2st or Hs6st1 form a normally shaped brain. Hematoxylin and eosin-stained wax sections of heads from wild-type (A–C), Hs2st−/− (D–F), and Hs6st1−/− (G–I) E17.5 embryos. A, D, G, Sagittal sections showing the olfactory bulbs (ob), cerebral cortex (cc), thalamus (t), and superior colliculus (sc). The position of the optic chiasm (oc) is marked. B, E, H, Coronal sections through the forebrain at the point at which the optic nerves (on) have nearly reached the optic chiasm, showing the structure of the brain around the midline. C, F, I, Coronal sections through the eye showing the structure of the lens (l), retina (r), and optic nerve as it exits the eye. J, Diagram summarizing the normal development of the visual pathway. RGC axons exit the retina (r) and bundle together to form the optic nerve (on) as they navigate to the optic chiasm (oc) at the ventral midline (M), where they are sorted into the optic tracts (ot). RGC axons normally follow smooth trajectories and do not escape normal chiasm boundaries or innervate the opposite eye in large numbers. P, Posterior; A, anterior; Di, distal; Pr, proximal. Scale bars: A, D, G, 1 mm; B, C, E, F, H, I, 500 μm.
Figure 3.
Figure 3.
The Hs2st−/− optic chiasm is disorganized at E15.5. Images of Hs2st+/+ (A–E), Hs6st1−/− (F), and Hs2st−/− (G–M) chiasms labeled by DiI injection into the retina (A–L) or the optic tract (M) are shown. A, B, and G–I are epifluorescence images, and C–F and J–M are confocal images. The arrows in H–J, L, and M mark axons growing aberrantly outside normal chiasm territory in the mutant. A, B, and G, H are adjacent horizontal sections in which A and G are ventral to B and H. H shows a particularly extreme example of axon growth up the midline with a milder example shown in I. D, F, K, DiI labeling of the chiasm after focal DiI injection; in Hs2st+/+ (D) and Hs6st1−/− (F) embryos, RGC axons traverse the chiasm approximately parallel to one another, whereas Hs2st−/− mutant RGC axons (K) are less ordered (boxed area in K shown in K′ illustrating disordered axons). E, L, M, Three-dimensional reconstructions of DiI-labeled chiasms after DiI injection into the retina (E, L) or the optic tract (M). In each case, the underside of the reconstructed chiasm is viewed from the front. The arrows mark axons escaping up the midline in L or defasciculating at the chiasm before growing to the thalamus in M. DiI injections summarized in diagram at the bottom and indicated by red asterisks in the panels. N, Diagram summarizing aberrant RGC axon trajectories in the Hs2st−/− mutant. R, Retina; on, optic nerve; oc, optic chiasm; ot, optic tract; P, posterior; A, anterior; Di, distal; Pr, proximal; M, ventral midline. Scale bars: A, E, 400 μm; B, H, I, 200 μm; C–F, J–M, 100 μm; K′, 10 μm.
Figure 4.
Figure 4.
The Hs6st1−/− chiasm has a normal shape but unusually large numbers of RGC axons innervate the opposite eye. All panels are horizontal sections through the chiasm (A–C, F–H) or the retina (D, E, I, J) after unilateral DiI injection into the retina. In C–E and H–J, DiA has been injected into the optic tract on the same side as the DiI-injected eye. A–E, In the wild type, relatively few RGC axons enter the contralateral optic nerve at E14.5 (A), E15.5 (C), and E17.5 (B). D, E, At E15.5, very few RGCs in the contralateral eye are retrogradely labeled with DiI. The boxed area in D is magnified in E. F–J, In the mutant, the overall shape of the chiasm closely resembles that of the wild type at E14.5 (F), E15.5 (H), and E17.5 (G). However, many more axons enter the contralateral optic nerve (con) than in the wild type at these ages. I, J, In contrast to the wild type, many RGC bodies in the contralateral retina are retrogradely labeled with DiI. The boxed area in I is magnified in J. Note that RGCs labeled with DiI from the contralateral eye are not colabeled with DiA, indicating that they do not project to the DiA injection site in the thalamus. All sections are horizontal with posterior at the top. DiI and DiA injections summarized in diagram at the bottom and indicated by red or green asterisks, respectively, in the panels. K, Histogram showing numbers of RGCs retrogradely labeled in the contralateral retina after unilateral retinal DiI injection. Significantly more retrogradely labeled RGCs were counted in the Hs6st1−/− retina then in the wild type (p = 0.006, Student's t test). Note that Hs2st−/− did not exhibit increased innervation of the opposite eye; in fact, there was a significant decrease compared with wild type (p = 0.04, Student's t test). The total numbers of DiI-labeled RGCs were counted in serial sections. All bars are means ± SEM. Student's t test for comparison with wild type, ∗p < 0.05. L, Diagram summarizing aberrant growth of RGC axons into the contralateral optic nerve of the Hs6st1−/− mutant. r, Retina; l, lens; on, optic nerve; con, optic nerve contralateral to injected retina; oc, optic chiasm; ot, optic tract; P, posterior; A, anterior; Di, distal; Pr, proximal; M, ventral midline. Scale bars: A–C, F–H, 200 μm; D, I, 100 μm; E, J, 50 μm.
Figure 5.
Figure 5.
Quantitative analysis of Hs2st and Hs6st1 transcript levels in the retina and optic chiasm of E14.5 mice by qRT-PCR. Expression levels of Hs2st and Hs6st1 mRNA were each normalized to that of a ubiquitously expressed housekeeping gene, GAPDH, and expressed as mean ± SEM. Hs2st and Hs6st1 mRNAs are detectable in the retina and at the chiasm, with both transcripts present at significantly higher levels at the chiasm (Student's t test, p < 0.05).
Figure 6.
Figure 6.
Hs2st expression in the retina and at the optic chiasm revealed by X-gal staining of E15.5 Hs2st+/LacZ sections. A–D, Thin (10 μm) coronal cryostat sections stained to completion. Hs2st is expressed widely in neural and non-neural tissues, although there is considerable variation in staining intensity between different regions. A, B, LacZ staining in the RGC layer of the retina. The boxed area in A is magnified in B. C, D, LacZ staining of cells around the optic chiasm. The boxed area in C is magnified in D. E–H, Thick (200 μm) horizontal vibratome sections through E15.5 Hs2st+/LacZ embryos in which X-gal staining was stopped before it reached completion to reveal sites of strong expression. E, Low-power view showing staining in cells surrounding the optic nerve and at the ventral midline but not in the retina. F, G, Higher magnification of consecutive sections showing staining in cells surrounding the optic nerve and at the point at which the optic nerve contacts the brain (F) and a more dorsal section showing staining dorsal and posterior to the chiasm (G). H, Section double stained with X-gal and anti-neurofilament antibody showing the relationship between neurofilament-stained RGC axons and the regions of X-gal staining. The arrow indicates coincidence between strong X-gal staining and neurofilament-labeled axons at the point at which the optic nerve joins the brain. I, Summary diagram of Hs2st expression (green). The trajectories of RGC axons (brown) at the optic chiasm in Hs2st−/− mutants is superimposed with arrows marking the coincidence between regions that normally express high levels of Hs2st and RGC axon navigation abnormalities when Hs2st function is lost (see Fig. 3). r, Retina; l, lens; on, optic nerve; oc, optic chiasm; ot, optic tract; Di, distal; Pr, proximal; A, anterior; P, posterior; rpe, retinal pigmented epithelium. Scale bars: A, C, E, 625 μm; D, F–H, 100 μm; B, 50 μm.
Figure 7.
Figure 7.
Hs6st1 expression in the retina and at the optic chiasm revealed by X-gal staining of E15.5 Hs6st1+/LacZ sections. A–D, Thin (10 μm) coronal cryostat sections stained to completion. Hs6st1 is expressed widely in neural and non-neural tissues, although there is considerable variation in staining intensity between different regions. A, B, LacZ staining in the RGC layer of the retina. The boxed area in A is magnified in B. C, D, LacZ staining of cells around the optic chiasm. The boxed area in C is magnified in D. Thick horizontal (E–H) or coronal (I) vibratome sections (200 μm) through E15.5 Hs6st1+/LacZ embryos in which X-gal staining was stopped before it reached completion to reveal sites of strong expression. E, Low-power overview showing strong staining around the chiasm but not in the retina or in cells surrounding the optic nerve. F, Higher magnification of the chiasm region. G–I, Sections double stained with X-gal and anti-neurofilament antibody. G, H, Horizontal sections through the chiasm to show the relationship between neurofilament-stained RGC axons and the regions of staining. The section in H is cut at an angle so that the left side shows RGC axons at the middle of the chiasm and the right side shows axons entering the chiasm along the optic nerve and exiting along the optic tract. The arrow indicates coincidence between strong X-gal staining and neurofilament-labeled axons at the point at which the optic nerve joins the brain. I, Coronal section through the posterior chiasm showing the lack of strong Hs6st1 expression at the midline above the chiasm. J, Summary diagram of Hs6st1 expression (purple). The trajectories of RGC axons (brown) at the optic chiasm in Hs6st1−/− mutants is superimposed with the arrow marking the coincidence between high levels of Hs6st1 expression at the point at which RGC axons misproject into the contralateral optic nerve when Hs6st1 function is lost (see Fig. 4). r, Retina; l, lens; on, optic nerve; oc, optic chiasm; ot, optic tract; Di, distal; Pr, proximal; A, anterior; P, posterior; rpe, retinal pigmented epithelium. Scale bars: A, C, E, 625 μm; D, F–I, 100 μm; B, 50 μm.
Figure 8.
Figure 8.
The expression patterns of molecules Nkx2.2, SSEA-1, and CD44 on cells around the optic chiasm are identical to the wild type in Hs2st−/− and Hs6st1−/− E15.5 embryos. The position of the midline is marked with an arrow. A–F are horizontal, anterior is down; G–I are coronal, ventral is down. A–C, Nkx2.2 immunohistochemistry on wax sections. Nkx2.2 is expressed by cells at the optic chiasm midline, posteriorly up the midline and also in the ventral diencephalon. D–I, Confocal images of cryostat sections immunostained with SSEA-1 (red) and CD44 (green) antibodies. Nuclei were counterstained with TOPRO-3 (blue). D–F, Ventral sections show one arm of the bilaterally symmetrical V-shaped SSEA-1 expression domain in the ventral diencephalon, posterior to retinal axons. CD44-positive cells and their processes are localized around the midline and overlap with SSEA-1-expressing cells at the anterior tip of the SSEA-1-expressing domain. G–I, Coronal sections through the anterior tip of the V-shaped SSEA-1 domain, just posterior to the optic chiasm. In the wild-type (G) and mutant (H, I) embryos, SSEA-1-positive processes appose retinal axons as they course over the pial surface of the ventral diencephalon. CD44 expression is confined to the midline. Scale bars: A–I, 200 μm.
Figure 9.
Figure 9.
Hs6st1 is required for Slit2 avoidance by RGC axons. A–D, Collagen cultures of E14.5 Hs6st1+/+ (A, B) or Hs6st1−/− (C, D) retinal explants (R) over a bed of Cos7 cell suspension (Cos7 cells) transfected with the empty vector mock (A, C) or the hSlit2-cmyc-expressing vector Slit2 (B, D). RGC axons are immunostained for neurofilament (NF) protein (green), and hSlit2-cmyc is immunostained for cmyc (red). Nuclei are stained blue with TOPRO3. In each case, a 3D reconstruction of the culture is shown as an elevated perspective and as a side view. Neurofilament+ pixel counts (mean ± SEM) are given below each image, showing that total RGC axon outgrowth is similar under all four culture conditions. E, F, Higher magnification of the Cos7 cell layer viewed from above. E, Hs6st1+/+ RGC axons tend to avoid Slit2+ cells (the arrow points to an RGC axon that has veered away from a Slit2+ cell). F, Hs6st1−/− RGC axons frequently grow over Slit2+ Cos7 cells (the arrow points to an example). G, Histogram comparing the percentage of hSlit2-cmyc+ (red bars) and hSlit2-cmyc (white bars) Cos7 cells contacted by Hs6st1+/+ and Hs6st1−/− RGC axons (see Results for full description of assay). The asterisk indicates a significant difference (Mann–Whitney rank–sum test, p < 0.05). H, Summary of the role of Hs6st1 in Slit2-mediated axon guidance based on these in vitro observations. The amount of Slit repulsion experienced by growth cones of each genotype is indicated by the size of the black circle. 6-O sulfated heparan (6S) allows Slit2 to exert its repulsive activity on RGC growth cones. In the absence of 6S, RGC growth cones no longer take evasive action when encountering a source of Slit2. Scale bars: A–D, 200 μm; E, F, 10 μm.

Similar articles

Cited by

References

    1. Bertuzzi S, Hindges R, Mui SH, O'Leary DDM, Lemke G (1999). The homeodomain protein Vax1 is required for axon guidance and major tract formation in the developing forebrain. Genes Dev 13:3092–3105. - PMC - PubMed
    1. Brown TA, Bouchard T, St John T, Wayner E, Carter WG (1991). Human keratinocytes express a new CD44 core protein (CD44E) as a heparan-sulfate intrinsic membrane proteoglycan with additional exons. J Cell Biol 113:207–221. - PMC - PubMed
    1. Bullock SL, Fletcher JM, Beddington RS, Wilson VA (1998). Renal agenesis in mice homozygous for a gene trap mutation in the gene encoding heparan sulfate 2-sulfotransferase. Genes Dev 12:1894–1906. - PMC - PubMed
    1. Bulow HE, Hobert O (2004). Differential sulphations and epimerisation define heparan sulphate specificity in nervous system development. Neuron 41:723–736. - PubMed
    1. Cepko CL, Austin CP, Yang X, Alexiades M, Ezzeddine D (1996). Cell fate determination in the vertebrate retina. Proc Natl Acad Sci USA 93:589–595. - PMC - PubMed

Publication types

MeSH terms

LinkOut - more resources