

CpG island promoter methylation and silencing of 14-3-3sigma gene expression in LNCaP and Tramp-C1 prostate cancer cell lines is associated with methyl-CpG-binding protein MBD2
- PMID: 16786000
- PMCID: PMC1526774
- DOI: 10.1038/sj.onc.1209462
CpG island promoter methylation and silencing of 14-3-3sigma gene expression in LNCaP and Tramp-C1 prostate cancer cell lines is associated with methyl-CpG-binding protein MBD2
Abstract
14-3-3sigma proteins regulate numerous cellular processes that are important to cancer development. One of its biological roles involves G2 cell-cycle arrest following DNA damage. It has also been reported that the loss of 14-3-3sigma expression via CpG methylation may contribute to malignant transformation by impairing the G2 cell-cycle checkpoint function, thereby allowing an accumulation of genetic defects. However, how the CpG methylation-dependent silencing mechanism works in relation to promoter methylation associated with methyl-CpG-binding proteins (MeCPs) is still unclear. To better understand the mechanism, we first examined the methylation status of the 14-3-3sigma promoter-associated CpG islands and 14-3-3sigma gene expression in a subset of prostate cancer cell lines using methylation-specific PCR (MSP), an HhaI-based DNA methylation assay, and reverse transcription-PCR (RT-PCR). We found that the 14-3-3sigma expression is lost in LNCaP and Tramp-C1 prostate cancer cell lines and that this expression is restored after treatment with epigenetic silencing modifiers 5-aza-2'-deoxycytidine (5-aza) and trichostatin A (TSA). These results imply transcriptional silencing via promoter-associated CpG methylation. Chromatin immunoprecipitation analysis revealed that methyl-CpG-binding protein 2 (MBD2) is associated preferentially to the methylated CpG island in the 14-3-3sigma promoter in LNCaP and Tramp-C1 cells but not in 14-3-3sigma-expressing PC3 and DU145 cells, which contain an unmethylated CpG island in the 14-3-3sigma promoter region. The 14-3-3sigma gene silencing because of CpG methylation correlates with binding of MBD2. In addition, the activation of 14-3-3sigma gene expression by a combination of 5-aza and TSA also involves the release of the MBD2 from the 14-3-3sigma promoter-methylated CpG island in LNCaP and Tramp-C1 cells. Furthermore, MBD2 knockdown by siRNA stimulated 14-3-3sigma expression in LNCaP cells. We also investigated whether the loss of 14-3-3sigma expression in LNCaP and Tramp-C1 cells affects cell proliferation by MTT assays. Interestingly, we observed that 14-3-3sigma-inactivated LNCaP and Tramp-C1 cells had markedly decreased cell proliferation and protein expression of proliferation cell nuclear antigen (PCNA) after restoration of 14-3-3sigma expression with 5-aza and TSA treatment. On the other hand, the same treatment did not significantly affect 14-3-3sigma-active PC3 and DU145 cells, which normally express 14-3-3sigma. Finally, 14-3-3sigma knockdown by siRNA resulted in increased proliferation in PC3 and DU145 cells. These findings suggest that the transcriptional silencing of the 14-3-3sigma gene is caused by promoter CpG island methylation associated with MBD2, and that this may play an important role in prostate cancer progression during the invasive and metastatic stages of the disease.
Figures
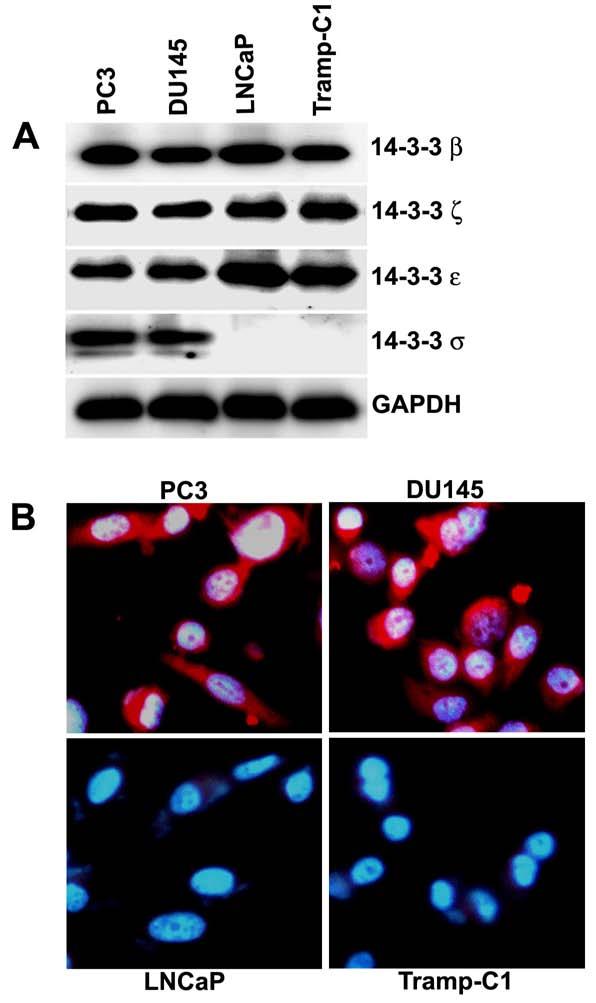
Immunoblot analysis of 14-3-3 proteins in prostate cancer cell lines PC3, DU145, LNCaP and Tramp-C1. Equal amounts of total cellular protein lysates extracted from each of the cell lines were electrophoresed on SDS-PAGE, subjected to immunoblot with anti-14-3-3β, anti-14-3-3ξ, anti-14-3-3ε, anti-14-3-3σ, and anti-GAPDH antibodies, and followed by chemiluminescence detection. GAPDH was used as a loading control.
Immunostaining for 14-3-3σ protein expression in PC3, DU145, LNCaP and Tramp-C1 cells with anti-14-3-3σ antibodies (red signal). Nuclei were stained with DAPI (blue signal).
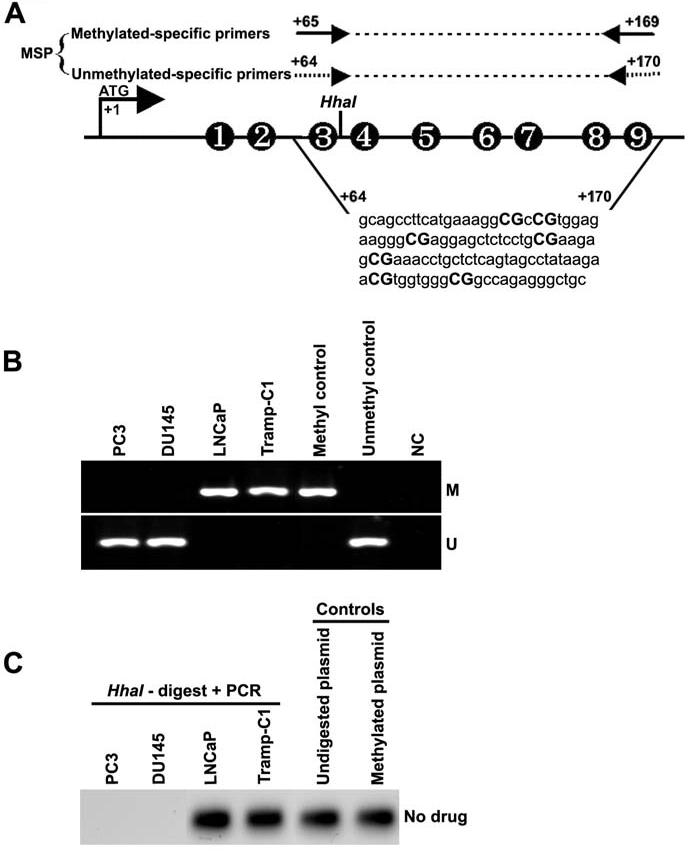
Schematic map of the 14-3-3σ promoter-associated CpG island region indicating the location of PCR primers used for MSP analysis. Each of the CpG dinucleotide residues with respect to the transcriptional start site ATG (+1) is shown as numbers in circles from 1 to 9, which can serve as potential DNA methylation sites. The nucleotide sequence located in the promoter region of the human 14-3-3σ gene from +64 to +170 and CpG dinucleotides are indicated in bold.
Bisulfite-modified DNA derived from prostate cancer cell lines PC3, DU145, LNCaP and Tramp-C1 were amplified with 14-3-3σ primers specific for methylated (top) and unmethylated DNA (bottom). Methylation-specific primers generated the PCR products labeled with “M”. Those labeled with “U” were generated by primers specific for unmethylated DNA. Positive and negative controls were described in Materials and Methods.
HhaI-based DNA methylation assay of the 14-3-3σ promoter. Genomic DNA was prepared from prostate cancer cell lines PC3, DU145, LNCaP and Tramp-C1. HhaI cut within the 14-3-3σ PCR primer target site, thereby preventing PCR amplification in unmethylated samples. SssI-methylated, 14-3-3σ plasmid DNA and undigested 14-3-3σ plasmid DNA were used as positive controls.
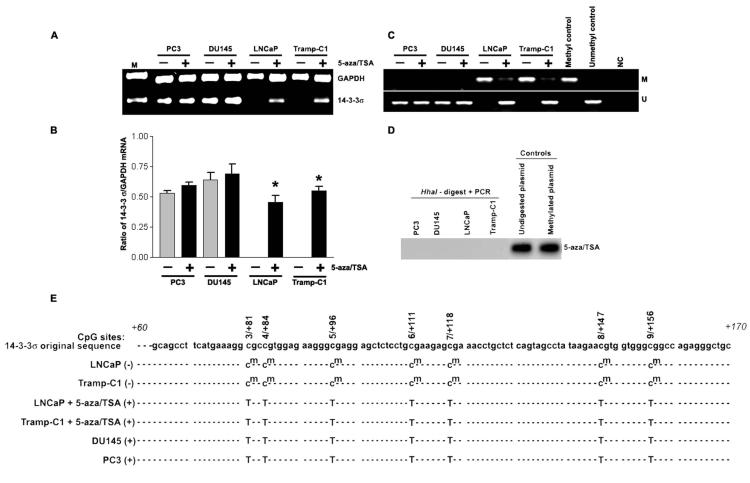
mRNA expression of 14-3-3σ was analyzed using reverse transcription-PCR in LNCaP, DU145, PC3 and Tramp-C1 prostate cancer cells treated with either DMSO (control) or 10 μM 5-aza followed by 50 nM TSA, as described in Materials and Methods. GAPDH mRNA was co-amplified as a loading control and expression standard.
Bar diagram showing densitometry quantified data of 14-3-3σ/GAPDH mRNA ratios from three independent experiments. Each bar represents triplicate analyses of mean ± SD where significant difference from cells treated with vehicle alone (control) is represented by an asterisk * (P <0.05).
MSP assay on DNA isolated from 5-aza/TSA-treated or untreated cell lines PC3, DU145, LNCaP and Tramp-C1. Methylation-specific primers generated the PCR products labeled with “M”. Those labeled with “U” were generated by primers specific for unmethylated DNA. Positive and negative controls were described in Materials and Methods.
HhaI-based DNA methylation assay on DNA isolated from 5-aza and TSA-treated PC3, DU145, LNCaP and Tramp-C1 cells. SssI-methylated, 14-3-3σ plasmid DNA and undigested 14-3-3σ plasmid DNA were used as positive controls.
Bisulfite sequencing analysis of 14-3-3σ promoter CpG island methylation in 5-aza/TSA treated or untreated prostate cancer cells. Seven potential CpG sites (3/+81 to 9/+156, genomic positions 8721, 8724, 8736, 8751, 8758, 8787, and 8796; Accession No. AF029081) were analyzed by methylation-specific PCR followed by cloning and DNA sequencing. Methylated cytosines remain cytosines (cm), whereas unmethylated cytosines are converted thymidine (T). Absence of 14-3-3σ expression (−) and presence of 14-3-3σ expression (+). Results are representative of at least 4 different DNA sequence analyses.
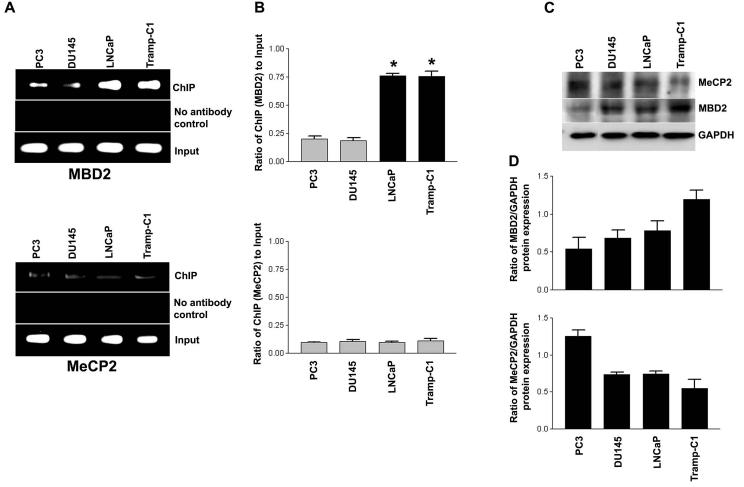
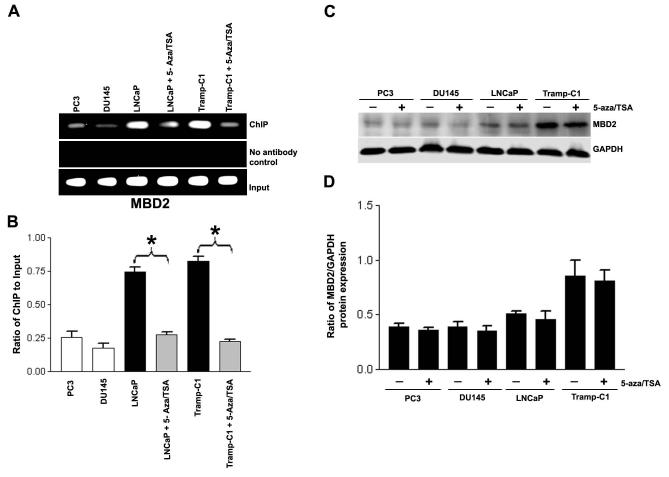
Assessment of MBD2 and MeCP2 binding on the 14-3-3σ promoter by ChIP analyses. The bound MeCPs fraction (ChIP) shows binding to the 14-3-3σ promoter. Crosslinked chromatin was carefully prepared from 14-3-3σ-expressing (PC3 and DU145) and non-expressing (LNCaP and Tramp-C1) prostate cancer cells, sonicated to shear DNA fragments below 1000 bp, and immunoprecipitated with the indicated antibodies. Sheared chromatin fractions above this upper limit were not processed for ChIP mapping of the 14-3-3σ promoter. The immunoprecipitates were subjected to PCR analysis using primer pairs spanning the 14-3-3σ promoter-associated CpG island (depicted schematically in Fig. 2A). Aliquots of chromatin taken before immunoprecipitation were used as “Input” controls whereas chromatin eluted from immunoprecipitations lacking antibody were used as “no antibody” (−Ab) controls.
Quantification of the MBD2 and MeCP2 ChIP fractions on the 14-3-3σ promoter. ChIP quantification was plotted as a ratio of bound MBD2 or MeCP2 ChIP (no antibody control: bound) to input signal and expressed as bound MBD2 or MeCP2 on the y-axis. Each bar represents the mean ± SD of three independent assays where significant differences from 14-3-3σ-expressing (PC3 and DU145) cells, which exhibited low or undetectable bound MBD2 on the 14-3-3σ promoter, are represented by asterisks * (P <0.05).
Immunoblot of MeCP2 and MBD2 proteins. Equal amounts (100 μg) of protein from cells were separated by SDS-PAGE, transferred to a nitrocellulose membrane, and subjected to immunoblot analysis with antibodies specific for MeCP2, MBD2 and GAPDH. GAPDH was utilized as a loading control.
Bar diagram showing densitometry quantified data of MBD2 or MeCP2/GAPDH protein expression ratios from three independent experiments. Each bar represents triplicate analyses of mean ± SD.
ChIP assay of MBD2. The formaldehyde crosslinked chromatin was immunoprecipitated with antibodies specific for MBD2. Purified DNA was amplified for the 14-3-3σ promoter as described in Fig. 4. MBD2 dissociate from the 14-3-3σ promoter-associated CpG island following treatment of LNCaP and Tramp-C1 cells with 5-aza and TSA, as described in Materials and Methods. Controls show input genomic DNA before the addition of antibody and eluants from no antibody immunoprecipitations.
Quantification of the MBD2 ChIP fractions on the 14-3-3σ promoter as described in Fig. 4. Each bar represents triplicate analyses of mean ± SD where significant difference from cells treated with vehicle alone (control) is represented by an asterisk * (P <0.05).
MBD2 protein expression in total cell lysates from 5-aza and TSA-treated and untreated PC3, DU145, LNCaP and Tramp-C1 cells. Equal amounts (100 μg) of protein from control or treated cells were separated by SDS-PAGE, transferred to a nitrocellulose membrane, and subjected to immunoblot analysis with antibodies specific for MBD2 and GAPDH. GAPDH was utilized as a loading control.
Bar diagram showing densitometry quantified data of MBD2/GAPDH protein expression ratios from three independent experiments. Each bar represents triplicate analyses of mean ± SD.
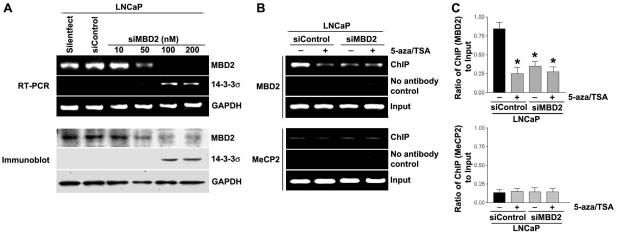
LNCaP cells were transfected with siRNA against MBD2. Specific knockdown of MBD2 mRNA (top) and MBD2 protein expression (bottom) were monitored by reverse-transcription PCR and immunoblot analysis, respectively.
The siRNA-coupled ChIP assay to access the binding levels of MBD2 and MeCP2 on the 14-3-3σ promoter. MBD2 siRNA or nonspecific siRNA control transfected LNCaP cells were used for ChIP assays as described in Fig. 4 & 5.
Bar diagram showing densitometry quantified data of MBD2/GAPDH (top) and MeCP2/GAPDH protein expression ratios (bottom) from three independent experiments. Each bar represents triplicate analyses of mean ± SD where significant difference from controls is represented by an asterisk * (P <0.05).
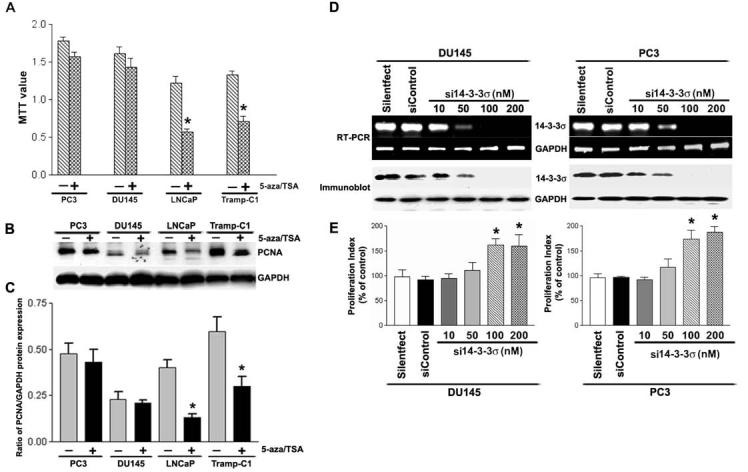
Results of the MTT assay showed that 5-aza and TSA (epigenetic 14-3-3σ silencing modifiers) caused significant inhibition of proliferation in LNCaP and Tramp-C1 cells. There was no significant difference following treatment with 5-aza and TSA in PC3 and DU145 cells. Each bar represents triplicate analyses of mean ± SD where significant difference from controls is represented by an asterisk * (P <0.05).
Immunoblot analysis of PCNA (a cellular proliferation marker) in prostate cancer cells before and after treatment with 5-aza and TSA. Equal amounts (10 μg) of protein from control and treated cells were separated by SDS-PAGE, transferred to a nitrocellulose membrane, and subjected to immunoblot analysis with antibodies specific for PCNA and GAPDH. GAPDH was used as a loading control.
Bar diagram showing densitometry quantified data of PCNA/GAPDH protein expression ratios from three independent experiments. Each bar represents triplicate analyses of mean ± SD where significant difference from cells treated with vehicle alone (control) is represented by an asterisk * (P <0.05).
DU145 and PC3 cells were transfected with siRNA against 14-3-3σ. Specific knockdown of 14-3-3σ mRNA (top) and 14-3-3σ protein expression (bottom) were monitored by reverse-transcription PCR and immunoblot analysis, respectively.
Proliferation index of DU145 and PC3 cells transfected with either 14-3-3σ specific siRNA or nonspecific siRNA control was revealed by MTT assay. Each bar represents triplicate analyses of mean ± SD where significant difference from controls is represented by an asterisk * (P <0.05).
Similar articles
-
Frequent 14-3-3 sigma promoter methylation in benign and malignant prostate lesions.DNA Cell Biol. 2005 Apr;24(4):264-9. doi: 10.1089/dna.2005.24.264. DNA Cell Biol. 2005. PMID: 15812243
-
Prostate cancer is characterized by epigenetic silencing of 14-3-3sigma expression.Oncogene. 2004 Dec 2;23(56):9034-41. doi: 10.1038/sj.onc.1208004. Oncogene. 2004. PMID: 15489902
-
14-3-3sigma gene silencing during melanoma progression and its role in cell cycle control and cellular senescence.Mol Cancer. 2009 Jul 30;8:53. doi: 10.1186/1476-4598-8-53. Mol Cancer. 2009. PMID: 19642975 Free PMC article.
-
The role of epigenetic inactivation of 14-3-3sigma in human cancer.Cell Res. 2005 Apr;15(4):237-46. doi: 10.1038/sj.cr.7290292. Cell Res. 2005. PMID: 15857578 Review.
-
Epigenetic and proteolytic inactivation of 14-3-3sigma in breast and prostate cancers.Semin Cancer Biol. 2006 Jun;16(3):235-9. doi: 10.1016/j.semcancer.2006.03.006. Epub 2006 Apr 1. Semin Cancer Biol. 2006. PMID: 16682214 Review.
Cited by
-
MicroRNA-mediated drug resistance in breast cancer.Clin Epigenetics. 2011 Aug;2(2):171-185. doi: 10.1007/s13148-011-0040-8. Epub 2011 Jun 27. Clin Epigenetics. 2011. PMID: 21949547 Free PMC article.
-
MBD2 Correlates with a Poor Prognosis and Tumor Progression in Renal Cell Carcinoma.Onco Targets Ther. 2020 Oct 7;13:10001-10012. doi: 10.2147/OTT.S256226. eCollection 2020. Onco Targets Ther. 2020. PMID: 33116585 Free PMC article.
-
Epigenetic alterations in TRAMP mice: epigenome DNA methylation profiling using MeDIP-seq.Cell Biosci. 2018 Jan 12;8:3. doi: 10.1186/s13578-018-0201-y. eCollection 2018. Cell Biosci. 2018. PMID: 29344347 Free PMC article.
-
Epigenetic inactivation of the tissue inhibitor of metalloproteinase-2 (TIMP-2) gene in human prostate tumors.Oncogene. 2007 Aug 9;26(36):5229-37. doi: 10.1038/sj.onc.1210329. Epub 2007 Feb 26. Oncogene. 2007. PMID: 17325663 Free PMC article.
-
Nrf2 expression is regulated by epigenetic mechanisms in prostate cancer of TRAMP mice.PLoS One. 2010 Jan 5;5(1):e8579. doi: 10.1371/journal.pone.0008579. PLoS One. 2010. PMID: 20062804 Free PMC article.
References
-
- Baylin SB, Herman JG. Trends Genet. 2000;16:168–174. - PubMed
-
- Bird A. Genes Dev. 2002;16:6–21. - PubMed
-
- Bird AP, Wolffe AP. Cell. 1999;99:451–454. - PubMed
-
- Chan TA, Hermeking H, Lengauer C, Kinzler KW, Vogelstein B. Nature. 1999;401:616–620. - PubMed
-
- Cheng L, Pan CX, Zhang JT, Zhang S, Kinch MS, Li L, Baldridge LA, Wade C, Hu Z, Koch MO, Ulbright TM, Eble JN. Clin Cancer Res. 2004;10:3064–3068. - PubMed
Publication types
MeSH terms
Substances
Grants and funding
LinkOut - more resources
Full Text Sources
Other Literature Sources
Research Materials
Miscellaneous
