. 2006 Jul 10;203(7):1721-32.
doi: 10.1084/jem.20052310. Epub 2006 Jun 19.

Critical roles of the immunoglobulin intronic enhancers in maintaining the sequential rearrangement of IgH and Igk loci

Affiliations

Critical roles of the immunoglobulin intronic enhancers in maintaining the sequential rearrangement of IgH and Igk loci

Matthew A Inlay et al. J Exp Med. .

Abstract

V(D)J recombination of immunoglobulin (Ig) heavy (IgH) and light chain genes occurs sequentially in the pro- and pre-B cells. To identify cis-elements that dictate this order of rearrangement, we replaced the endogenous matrix attachment region/Igk intronic enhancer (MiE(kappa)) with its heavy chain counterpart (Emu) in mice. This replacement, denoted EmuR, substantially increases the accessibility of both V(kappa) and J(kappa) loci to V(D)J recombinase in pro-B cells and induces Igk rearrangement in these cells. However, EmuR does not support Igk rearrangement in pre-B cells. Similar to that in MiE(kappa)(-/-) pre-B cells, the accessibility of V(kappa) segments to V(D)J recombinase is considerably reduced in EmuR pre-B cells when compared with wild-type pre-B cells. Therefore, Emu and MiE(kappa) play developmental stage-specific roles in maintaining the sequential rearrangement of IgH and Igk loci by promoting the accessibility of V, D, and J loci to the V(D)J recombinase.


Figures
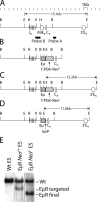
Figure 1.
Figure 1.
Generation of EμR knockin ES cells and mice. (A) Endogenous germline Igk locus. The lengths of the diagnostic restriction fragments and probes are shown. Markings above the diagram are spaced at 1-kb intervals. All maps are to scale. (B) Targeting construct to replace MiEκ with Eμ (striped rounded box) and floxed PGK-Neo r (f-PGK-Neo r; striped box). (C) Targeted locus with f-PGK-Neo r inserted. The size of the mutant EcoRI restriction fragment is shown. (D) Knockin allele with f-PGK-Neo r removed by Cre/loxP-mediated deletion. (E) Southern blotting analysis of ES cell genomic DNA digested with EcoRI and probed with probe A. First lane, WT ES cell DNA; second lane, heterozygous EμR ES cell with PGK-Neo r inserted; third lane, heterozygous EμR knockin with PGK-Neo r deleted. Bands corresponding to the WT, EμR with PGK-Neo r inserted, and knockin alleles are indicated on the right. B, BamHI; E, EcoRI; H, HindIII; X, XbaI.
Figure 2.
Figure 2.
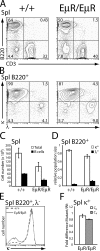
Analysis of splenic B cells in WT and EμR 5–8-wk-old littermates. (A) Flow cytometric analysis of B cells (B220+) and T cells (CD3+) in the spleens of WT and EμR mice. The genotypes are indicated at the top. Live cells (propidium iodide) within the lymphoid gate are shown. (B) κ/λ ratio of splenic B220+ cells. (A and B) Percentages of total cells within each quadrant are shown. (C) B cell counts in 1-mo-old WT and EμR spleens. Absolute numbers of total white blood cells (white bars) and B cells (black bars) are shown with error bars (SD; n = 4). (D) Proportions of splenic κ+ (white bars) and λ+ (black bars) B cells shown with error bars (SD; n = 5). (E) κ surface expression in WT (dashed line) and EμR (solid gray line) B220+, λ splenic lymphocytes. (F) Analysis of κ mRNA levels in κ+ splenic B cells by quantitative real-time PCR. The κ mRNA levels were normalized to GAPDH mRNA levels. The ratio of mRNA levels of Cμ and Cκ in EμR B cells relative to WT are shown with error bars (SD; n = 2).
Figure 3.
Figure 3.
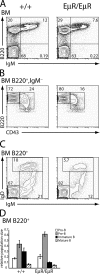
Analysis of BM B cell populations. (A) Flow cytometric analysis of BM from WT and EμR mice. Percentages of total cells within each quadrant are shown. Genotypes are indicated above each blot. (B) BM pro– and pre–B cell population. Only B220+, IgM cells within the lymphocyte gate are shown. (C) BM cells were stained with anti-B220, anti-IgM, and anti-IgD antibodies. Only B220+ cells are shown. Gates for pro–/pre–B cells (B220+/IgM/IgD), immature B cells (B220+/IgM+/IgD−,lo), and mature B cells (B220+/IgM+/IgDhi) are indicated. The percentages of total cells within the lymphoid gate are shown. (D) Statistical analysis of the populations of B lineage cells in the BM of 5–8-wk-old WT and EμR littermates (error bars represent SD; n = 2).
Figure 4.
Figure 4.
Igk rearrangement in +/+, EμR/EμR, and +/EμR mice. (A) PCR strategy to detect Igk rearrangement. Configuration of the rearranged Igk locus in WT and EμR B lineage cells. Location of the PCR primers and probe and the size of the PCR product for a Vκ to Jκ1 rearrangement are shown. (B) Semiquantitative PCR analysis of Igk rearrangement using primers VκD and MAR35 in the pro– and pre–B cells of WT and EμR mice. Genomic DNA was serially diluted fourfold. Bands corresponding to the rearrangement of Vκ to each of the four Jκ gene segments are indicated on the left. To control for the amount of genomic DNA used for PCR analysis, rearrangement of the IgH locus (VDJH) is shown in the bottom panel. The relative amount of genomic DNA used for the PCR reaction was determined by quantitative real-time PCR analysis of the β-actin gene and is shown at the bottom. (C) Quantitative analysis of Igk rearrangement in pro–B cells. The intensity of each amplified product of VκJκ rearrangement is normalized to the intensity of VDJH rearrangement. (D) Percentage of unrearranged Igk alleles (κGL) in WT and EμR pro– and pre–B cells. The primer annealing locations for the forward (κGLf) and reverse (κGLr) primers are shown. κGL levels were normalized to the levels of the β-actin genomic region. The percentage is calculated by dividing the κGL levels in +/+ or EμR/EμR pre–B cells by those in ES cells. Error bars represent SD. (E) PCR amplification of rearranged Igk alleles in sorted heterozygous (+/EμR) B lineage cells. Genomic DNA from sorted pro–, pre–, and mature B cells was amplified with the degenerate Vκ primer and primer K2. Bands corresponding to the rearrangements of Vκ to each of the four Jκ gene segments of the WT allele and EμR allele are indicated. The relative amount of genomic DNA used for the PCR reaction is shown at the bottom.
Figure 5.
Figure 5.
Analysis of VκJκ junctions and RS recombination in WT and EμR B cells. (A) Percentages of total VκJκ1 junctions with N-nucleotide insertions in sorted pro–, pre–, and mature B cells of WT and EμR mice. The number of sequences analyzed for EμR pro–, EμR pre–, EμR spleen κ+, and WT pre–B cells are 22, 24, 43, and 12, respectively. P values for the comparison of N nucleotides in EμR pre–B cell populations to that of WT pre–B cells are shown (two-tailed paired Student's t test). (B) Detection of pre–B cell rearrangements by real-time LM-PCR of Jκ1 SE breaks in WT and EμR pre–B cells. Samples were normalized to the β-actin locus. SEs detected in EμR pre–B cells are shown relative to WT. Error bar represents SD. (C) Proportions of several Vκ family members used in the VκJκ1 rearrangements in the pro–, pre–, and splenic κ+ B cells of EμR mice as well as WT pre–B cells. The four most commonly used Vκ families are shown. (D and E) Analysis of RS rearrangement in WT and EμR pro– and pre–B cells. (D) Diagram of PCR strategy. Only alleles that have undergone rearrangement between the iRS and RS sequences will amplify. (E) Genomic DNA was serially diluted fivefold and amplified with the iRS and RS2 primers. The relative amount of genomic DNA in the most concentrated samples of the PCR reaction was determined by quantitative real-time PCR analysis of the β-actin gene and is shown at the bottom.
Figure 6.
Figure 6.
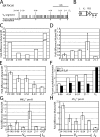
Analysis of accessibility of the JCκ region in WT and EμR pro– and pre–B cells. (A) Relative κ0GT expression in sorted pro– (left) and pre–B cells (right) of WT and EμR mice. κ0GT mRNA levels were normalized to the levels of β-actin mRNA. The κ0GT levels of all samples are relative to those in WT pre–B cells. P values, which are shown in each graph, were generated using the two-tailed paired Student's t test (error bars represent SD; n = 3). (B) MSRE-QPCR strategy. Restriction sites and primer annealing locations are shown. (C) MSRE-QPCR analysis of genomic DNA derived from pro– and pre–B cells of WT and EμR mice. Genomic DNA derived from ES cells and a hybridoma line (Hyb) was used as negative and positive controls. The ratio of the amplified products from the sample digested with HhaI versus those from the undigested sample is shown. The DNA amount used for PCR was normalized by the amplification of Cκ (primers Cκ1 and Cκ2). (D) CpG map in the JκCκ intron. Locations of the CpG dinucleotides are indicated by vertical lines below the map. Primers used to amplify bisulfite-treated DNA are indicated by arrowheads. (E) Methylation status of the 17 CpG dinucleotides within the JκCκ intron in the pro– and pre–B cells of WT and EμR mice. Each row of circles represents the methylation status of a single PCR product (one allele). 10 representative sequences from each sample are shown. The first circle (denoted by an asterisk) corresponds to the CpG site within the HhaI restriction site that was analyzed by MSRE-QPCR. (F) Percentage of the methylated CpG sites analyzed by bisulfite genomic sequencing. Percentages were calculated as the total number of methylated CpG sites divided by the total number of CpG sites analyzed. Bisulfite analysis of MiEκ-deleted loci is shown in Fig. S3 (available at http://www.jem.org/cgi/content/full/jem.20052310/DC1).
Figure 7.
Figure 7.
Analysis of V gene accessibility in Igk mutant mice. (A) Map of Igk locus. Locations of Vκ genes are represented by vertical lines. The six Vκ genes analyzed are labeled above and are represented with longer lines. The transcriptional orientation of each of the six Vκ genes is indicated by arrowheads below. The JCκ region is represented by a broken line. (B) Real-time PCR strategy to quantitate the amount of Vκ germline transcription (VκGT). A generic map of unrearranged Vκ gene segment is shown with leader (L) and Vκ exons (boxes) and the RSS sequence (triangles). Forward (f) and reverse (r) primers are indicated by arrowheads. (C) Vκ germline transcription (VκGT) in pooled WT and EμR pro–B cells. The amount of GTs of five Vκ genes was analyzed by quantitative real-time PCR and normalized to CD19 mRNA levels. The thick horizontal line at the relative VκGT value of five indicates a change in scale. (D) VκGT in WT and EμR pre–B cells. All VκGT levels were normalized to the levels of CD19 mRNA and the relative amount of unrearranged Vκ alleles in EμR pre–B cells versus that in WT pre–B cells, as shown in E. (C and D) The y axis represents the ratio of VκGT in EμR pro–/pre–B cells versus that in WT pro–/pre–B cells. Error bars represent SD. (F) Histone acetylation of Vκ in pools of WT and EμR pre–B cells analyzed by ChIP. The V regions analyzed are labeled on the x axis, and the percentage of chromatin immunoprecipitated from the total input chromatin is shown on the y axis. The primers used for the Vκ genes are the same as those used for the VκGT analysis, and the Cκ primers are the same as used in Fig. 5 B. (G and H) Germline transcription of Vκ and Jκ regions in MiEκ −/− (G) and 3′Eκ −/− (H) pre–B cells. The ratio of the GT levels in mutant pre–B cells versus those in WT pre–B cells is shown on the y axis.

Similar articles

Cited by

References

    1. Bassing, C.H., W. Swat, and F.W. Alt. 2002. The mechanism and regulation of chromosomal V(D)J recombination. Cell. 109:S45–S55. - PubMed
    1. Yancopoulos, G.D., and F.W. Alt. 1985. Developmentally controlled and tissue-specific expression of unrearranged Vh gene segments. Cell. 40:271–281. - PubMed
    1. Alt, F.W., T.K. Blackwell, and G.D. Yancopoulos. 1987. Development of the primary antibody repertoire. Science. 238:1079–1087. - PubMed
    1. Stanhope-Baker, P., K.M. Hudson, A.L. Shaffer, A. Constantinescu, and M.S. Schlissel. 1996. Cell type-specific chromatin structure determines the targeting of V(D)J recombinase activity in vitro. Cell. 85:887–897. - PubMed
    1. Sleckman, B.P., J.R. Gorman, and F.W. Alt. 1996. Accessibility control of antigen-receptor variable-region gene assembly: role of cis-acting elements. Annu. Rev. Immunol. 14:459–481. - PubMed

Publication types

MeSH terms

Substances